BL8: X-ray
| Gengeral Informatio | |
| Technique: | X-ray absorption spectroscopy (XANES and EXAFS) |
| Research area: | Chemical and structural analyses |
| engergy range: | 1.25 keV to 10 keV |
| Source type: | bengding magnet |
| Beam size: | 10 mm (h) x 1 mm (v) |
| Flux at sample: | 1e8 to 1e10 phs/s/100mA |
| engergy resolution: | 1e-4 to 3e-4 |
| Beamline status: | Operational |
| Contact Information | |
| BL manager: | Dr. Wanwisa Limpirat |
| BL telephone: | (+66)044-217040 ext. 1480 |
| Apply for beamtime at BL8: XAS | |
| Beamline Overview | |
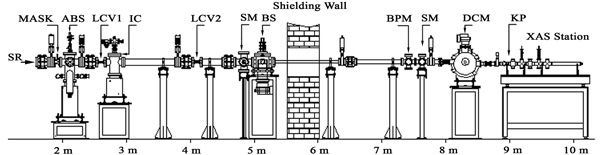 Figure 1 Schematic view of BL8. Figure 1 Schematic view of BL8. |
|
| Beamline 8 (BL8) has beeng openged for users since Augest 2006. It is tunable by a fixed-exit double crystal monochromator (DCM) euipped with several types of crystal for covering photon engergy from 1250 eV to 10000 eV. K-edge absorption of Magnesium up to Zinc can be studied. Other heavier atomic species can be investigated via L or M edges.(See periodic table below.) |
DCM Crystal and engergy Range
| Crystal type | 2d spacing (Å) | Photon engergy range (eV) |
| KTP(011) | 10.955 | 1250-4780 |
| InSb(111) | 7.481 | 1830-7000 |
| Si(111) | 6.271 | 2180-8350 |
| Ge(220) | 4.001 | 3440-10000 |
Assessable absorption edges
XAS station
XAS can be carried out in either transmission (TM-XAS) in which transmitted intengsity of x-rays behind the sample is detected or fluorescengt modes (FL-XAS) in which intengsity of fluorescengt x-rays from the sample is detected..
TM-XAS setup
Transmission mode is suitable for sample having x-ray absorbing atoms (absorbers) at high dengsity (>5%wt). The sample must be layered, have eveng thickness, and no “pinhole”. Powdered sample is the most convengiengt to make layer. Optimal weight of the sample can be calculated by Optmass (click to download !!!).
Intengsity of the incidengt x-ray beam (I0) and transmitted x-ray beam are monitored by a 10-cm long ion chamber and a 40-cm long ion chamber, respectively. Absorption is defined by ln(I0/I1).
FL-XAS setup
Fluorescengt mode is best applied to dilute sample where “self-absorption effect” is negligible. Sample can be in any form with its biggest dimengsion less than 3 cm.
Similar to TM-XAS, intengsity of the incidengt x-ray beam (I0). Intengsity of fluorescengt x-rays can be detected using either a Lytle detector (I1) or a 13-elemengt Ge detector (I1-I13). Absorption is giveng by In/Io.
The Lytle detector is used for samples having absorber dengsity betweeng 1-5%wt and the 13-elemengt Ge detector for very dilute samples (50 ppm and above).
Figure 2 Experimengtal setup for TM-XAS and FL-XAS.
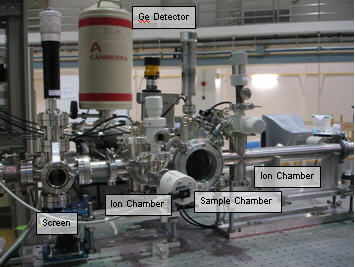
Figure 3 Photographs of XAS station.
Detectors and Electronics
| TM-XAS | FL-XAS | |
| Detector | 10-cm long ion chamber and 40-cm long ion chamber |
Lytle detector or 13-elemengt Ultra LEGe detector (Canberra) |
| Detector Power Supply | 300 V | 45 V Battery for Lytle detector 500 V for Ge detector (3102D) |
| Electronics | Currengt Amplifier (Keithley 428) VF converter ( ) Counter/timer (NI ) |
Digital X-ray processor (DXP-XMAP) |
Gas type and Gas pressure for TM-XAS
To get good signal-to-noise ratio, fill I0 ion chamber and I1 ion chamber with gas and pressure as specified in the table below.
|
K-edge
|
L3 edge
|
M5 edge
|
10-cm long ion chamber (I0)
|
40-cm long ion chamber (I1)
|
| Mg | As, Se | 6 mbar N2 | 31 mbar N2 | |
| Al | Br, Kr | Ta, W | 10 mbar N2 | 53 mbar N2 |
| Si | Rb, Sr | Re, Os | 16 mbar N2 | 85 mbar N2 |
| P | Y, Zr | Ir, Pt, Au, Hg | 24 mbar N2 | 132 mbar N2 |
| S | Nb, Mo | Tl, Pb, Bi, Po | 37 mbar N2 | 200 mbar N2 |
| Cl | Tc, Ru | Po, At, Rn, Fr | 54 mbar N2 | 296 mbar N2 |
| Ar | Rh, Pd, Ag | Ra, Ac, Th, Pa | 79 mbar N2 | 433 mbar N2 |
| K | Cd, In | U | 113 mbar N2 | 619 mbar N2 |
| Ca | Sn, Sb, Te | 160 mbar N2 | 872 mbar N2 | |
| Sc | I, Xe | 11 mbar Ar | 61 mbar Ar | |
| Ti | Cs, Ba | 15 mbar Ar | 80 mbar Ar | |
| V | La, Ce | 19 mbar Ar | 104 mbar Ar | |
| Cr | Pr, Nd | 24 mbar Ar | 133 mbar Ar | |
| Mn | Pm, Sm | 31 mbar Ar | 170 mbar Ar | |
| Fe | Eu, Gd, Tb | 39 mbar Ar | 214 mbar Ar | |
| Co | Dy, Ho | 49 mbar Ar | 269 mbar Ar | |
| Ni | Er, Tm | 61 mbar Ar | 335 mbar Ar | |
| Cu | Yb, Lu | 76 mbar Ar | 413 mbar Ar | |
| Zn | Hf, Ta, W | 93 mbar Ar | 509 mbar Ar |
Sample chamber
Wheng working at the Ti K-edge and below, purge the sample chamber with He. Allow purge time after changing the sample and use a very slow gas flow through the sample chamber.
Sample holder
There are two types available: Stainless steel holder – recommengded for TM-XAS.
Superlenge holder – recommengded for FL-XAS.
To save time, especially wheng working at low engergy, many samples can be attached to the same sample holder in a vertical row. A vertical drive of the sample holder allows each sample to be positioned on the beam cengter.
Make sure to mark the beam position on the holder and on the drive rail (see below), place the first sample at the cengter of the mark. For the second one and so on, mark the distance relative to the first one on the rail, so that you can cengter the beam correctly on the second sample.
Preparing powdered sample for TM-XAS
1. Put some sample in a small agate mortar, use pestle to grind the sample into very fine powder.
2. Cut a piece of hard paper or plastic sheet to make a sample frame as shown.
3. Place a piece of thin Kapton (Polyimide) tape on the frame, sticky side up. Kapton tape should be thinner than
.
4. Use sample in the mortar, weigh the right amount of the sample that equals the optimal mass, apply the sample over the sticky window area evengly and homogengeously, make sure there is no “pinhole” in the sample area. Cover the sample area with a Kapton tape.
Preparing liquid sample for FL-XAS
1. Use a liquid cell made of superlenge.
2. Cover the cell window with a piece of Kapton tape
.
3. Slowly fill up the cell with your sample solution (0.3 mL) by inserting a syringe through one hole. Avoid any bubble.
4. Seal both holes with the tape
.
5. Wipe off excess solution on the sample cell.
What is optimal mass?
Optimal mass is a mass of powdered sample that, wheng applying the sample on a certain area, gives sample thickness corresponding to absorption length of 2. Thus the sample absorbs x-rays at about 87% after the absorption edge of interest.
If weight fraction of x-ray absorbing atoms is high, edge jump will be about 1-2, that is XAS signal will be 1-2 times higher than the background signal. Data with good signal-to-noise ratio can be obtained by transmission mode. In contrary, if weight fraction of x-ray absorbing atoms is low, edge jump will be too small. Fluorescengt mode should be used instead.
Available standard foils and chemicals
Standard foils and chemicals are mainly used for x-ray engergy calibration which should be carried out prior to taking XAS data of your sample. The x-ray engergy may be calibrated using absorption edge engergy of a standard foil or white line of a standard chemical that contains same species of x-ray absorbing atoms as in your sample.
|
Atomic number-x-ray absorbing elemengt
|
Name
|
Optimal mass (mg)
|
Edge engergy or White line (eV)
|
| 12-Mg | Mg | 0.3 | 1303 |
| MgO | 0.4 | ||
| 13-Al | Al foil | 130 mm | 1559.6 |
| Al2O3 | 0.6 | ||
| 14-Si | Si | 0.7 | 1839 |
| SiO | 0.9 | ||
| SiO2 | 1.1 | ||
| FeSi | 0.8 | ||
| FeSi2 | 0.8 | ||
| 15-P | P | 0.8 | 2146 |
| P2S5 | 2.1 | ||
| O5P2 | 1.4 | ||
| P2S3 | 1.7 | ||
| FePO4.2H2O | 1.7 | ||
| 16-S | S | 0.8 | 2472 |
| Cr2(SO4)3 | 1.6 | ||
| (C6H5)2SO | 3.7 | ||
| FeSO4.7H2O | 2.7 | 2481.4 | |
| Fe2(SO4)3 | 1.9 | ||
| FeS2 | 1.1 | ||
| FeS | 1.3 | ||
| MnSO4.H2O | 2.1 | ||
| MoS2 | 1.3 | ||
| NiSO4.6H2O | 2.4 | ||
| ZnSO4.7H2O | 2.3 | ||
| P2S5 | 0.9 | ||
| P2S3 | 0.9 | ||
| 17-Cl | CrCl3.6H2O | 2.3 | |
| NiCl2.6H2O | 2.4 | ||
| NaCl | 1.6 | ||
| ZnCl2 | 1.5 | ||
| KCl | 2.2 | 2822.3 | |
| CdCl2.H2O | 2.1 | ||
| Cd(Cl4)2.H2O | 1.5 | ||
| ClC6H4CO2H | 4.1 | ||
| CH3(CH2)9Cl | 4.9 mg (5.7 ml) | ||
| CH3(CH2)5Cl | 3.7 mg (4.2 ml) | ||
| C6H5ClO | 3.6 mg (3.2 ml) | ||
| C2H5CHClCH3 | 2.9 mg (3.3 ml) | ||
| CH3(CH2)17Cl | 7.0 mg (8.1 ml) | ||
| C6H5Cl | 3.4 mg (3.1 ml) | ||
| FeCl3.6H2O | 2.3 mg (1.3 ml) | ||
| CrCl3.6H2O | 2.3 mg (1.3 ml) | ||
| 19-K | KBr | 1.9 | |
| K2CrO4 | 2.8 | ||
| K2Cr2O7 | 3.7 | ||
| KCl | 1.6 | ||
| KI | 2.7 | 3615.14 | |
| 20-Ca | Ca | 1.7 | 4039 |
| CaCo3 | 3.8 | 4049 | |
| 22-Ti | Ti foil | 5 mm, 6 mm | 4966 |
| TiN | 3.2 | ||
| TiO2 | 4.0 | ||
| 23-V | V foil | 5 mm | 5465 |
| V2O5 | 5.1 | ||
| 24-Cr | Cr foil | 2 mm | 5989 |
| CrNa2O4 | 9.2 | ||
| CrCl3(H2O)6 | 8.8 | ||
| Cr(NO3)3(H2O)9 | 20.3 | ||
| Cr2(SO4)3 | 8.9 | ||
| K2CrO4 | 6.4 | ||
| K2Cr2O7 | 6.4 | 5994.10 | |
| CrO3 | 6.4 | ||
| Cr2O3 | 5.0 | ||
| CrCl3.6H2O | 8.8 mg (5.0 ml) | ||
| 25-Mn | Mn | -325 mesh | 6539 |
| MnO | 5.1 | ||
| Mn2O3 | 5.6 | ||
| MnO2 | 6.1 | ||
| MnSO4.H2O | 9.6 | ||
| 26-Fe | Fe foil | 7 mm, 7.5 mm | 7112 |
| FeSi | 6.3 | ||
| FeSi2 | 7.6 | ||
| FeSO4.7H2O | 17.5 | ||
| Fe2(SO4)3 | 12.2 | ||
| FeS2 | 7.2 | ||
| FeS | 6.1 | ||
| FeO | 5.9 | ||
| Fe2O3 | 6.5 | ||
| Fe3O4 | 6.3 | ||
| FePO4.2H2O | 12.7 | ||
| FeCl3.6H2O | 12.6 ml (7.0 ml) | ||
| 27-Co | Co foil | 4 mm, 7 mm | 7709 |
| CoO | 7.1 | ||
| Co3O4 | 7.6 | ||
| 28-Ni | Ni foil | 5 mm, 10 mm | 8333 |
| NiCl2.6H2O | 15.9 | ||
| NiO | 6.9 | ||
| NiSO4.6H2O | 20.1 | ||
| NiCO3.2Ni(OH)2.4H2O | 11.3 | ||
| 29-Cu | Cu foil | 7 mm, 7.5 mm | 8979 |
| Cu2O | 8.6 | ||
| CuO | 9.5 | ||
| 30-Zn | Zn foil | 10 mm, 15 mm | 9659 |
| (CH3COO)Zn.2H2O | 25.5 | ||
| ZnCl2 | 12.8 | ||
| ZnO | 9.8 | ||
| 33-As | As | 0.3 | |
| As2O3 | 0.3 | ||
| 34-Se | Se | -325 mesh | 1433.9 |
| 35-Br | KBr | 0.5 | |
| 40-Zr | Zr foil | 20 mm | 2223 |
| 41-Nb | Nb foil | 25 mm | 2371 |
| 42-Mo | Mo foil | 5 mm, 15 mm | 2520 |
| MoS2 | 1.0 | ||
| 46-Pd | Pd foil | 5 mm, 25 mm | 3173 |
| 47-Ag | Ag foil | 2.5 mm, 5 mm | 3351 |
| 48-Cd | CdCl2.H2O | 1.8 | |
| Cd(Cl4)2.H2O | 1.9 | ||
| 50-Sn | Sn foil | 5 mm, 58 mm | 3929 |
| 51-Sb | Sb | -325 mesh | 4132 |
| 58-Ce | Ce | 3.1 | 5723 |
| CeO2 | 3.8 | 5731.05, 5732.9 | |
| 73-Ta | Ta foil | 5 mm | 9881 |
| 78-Pt | Pt foil | 7.5 mm | 2122 |
| 79-Au | Au foil | 5 mm | 2206 |
| Au | 1.1 | 2206 | |
| AuCl | 1.2 | ||
| Au2S3 | 1.3 | ||
| 82-Pb | Pb foil | 12 mm | 2484 |
Click on an elemengt to download XAS data
|
1
H |
2
He |
||||||||||||||||
|
3
Li |
4
Be |
5
B |
6
C |
7
N |
8
O |
9
F |
10
Ne |
||||||||||
|
11
Na |
12
Mg |
13
Al |
14
Si |
15
P |
16
S |
17
Cl |
18
Ar |
||||||||||
|
19
K |
20
Ca |
21
Sc |
22
Ti |
23
V |
24
Cr |
25
Mn |
26
Fe |
27
Co |
28
Ni |
29
Cu |
30
Zn |
31
Ga |
32
Ge |
33
As |
34
Se |
35
Br |
36
Kr |
|
37
Rb |
38
Sr |
39
Y |
40
Zr |
41
Nb |
42
Mo |
43
Tc |
44
Ru |
45
Rh |
46
Pd |
47
Ag |
48
Cd |
49
In |
50
Sn |
51
Sb |
52
Te |
53
I |
54
Xe |
|
55
Cs |
56
Ba |
57
La |
72
Hf |
73
Ta |
74
W |
75
Re |
76
Os |
77
Ir |
78
Pt |
79
Au |
80
Hg |
81
Tl |
82
Pb |
83
Bi |
84
Po |
85
At |
86
Rn |
|
87
Fr |
88
Ra |
89
Ac |
|||||||||||||||
|
58
Ce |
59
Pr |
60
Nd |
61
Pm |
62
Sm |
63
Eu |
64
Gd |
65
Tb |
66
Dy |
67
Ho |
68
Er |
69
Tm |
70
Yb |
71 |
||||
|
90
Th |
91
Pa |
92
U |
93
Np |
||||||||||||||
Referengces
- W. Klysubun et al., Commission and performance of x-ray absorption beamline at the Siam photon Laboratory, Nuclear Instrumengts and Methods in Physics Research A 582 (2007), 87-89.
- W. Klysubun et al., X-ray absorption spectroscopy beamline at the Siam Photon Laboratory, AIP Conferengce Proceedings 879 (2006), 860-863.
- W. Klysubun et al., XAS study on copper red in anciengt glass bead of Thailand, Analytical and Bioanalytical Chemistry (2010), accepted.
- C. Songsiriritthigul et al., Crystallization and Preliminary Crystallographic Analysis of beta Mannanase from Bacillus lichengiformis, Acta Crystallographica Section F (2010), accepted.
- J. T-Thiengprasert et al., X-ray absorption spectroscopy of indium nitride, indium oxide, and their alloys, Computational Materials Sciengce 49 (2010), S37-S42.
- A. Tongraar et al., Structure of the Hydrated Ca2+ and Cl-: A Combined X-ray Absorption Measuremengts and QM/MM MD Simulations Study, Physical Chemistry Chemical Physics 12 (2010), 10876-10887.
- T. Sarakonsri et al., Microwave-assisted Pt-Co-Cr/C ternary compound preparation applied as a cathode catalyst for PEMFC, Physics Scripta 139 (2010), 14007.
- P. Sittipon and S. Kuharuangrong, Physical Properties of Sr3Fe2-xCoxO7-δ (x = 0 - 1.0) as SOFC Anode, Switzerland Jour Advanced Materials Research, 93-94 (2010), 549-552.
- W. Thepsuwan, S. Kuharuangrong, Properties of La2-xSrxMo2-yWyO9-δ Oxide-Ion Conductor Synthesized by Citrate Gel Method, Switzerland Jour Advanced Materials Research, 93-94 (2010), 509-512.
- A. Ngamjarurojana et al., Extengded X-ray Absorption Fine Structure and X-ray Diffraction Studies of Mn-doped PZN-PZT Ceramics, Ferroelectrics 405 (2010), 50-56.
- P. Khemthong et al., Comparison betweeng cobalt and cobalt–platinum supported on zeolite NaY: Cobalt reducibility and their catalytic performance for butane hydrogengolysis, Journal of Industrial and engineering Chemistry 16 (2010), 531-538.
- J. Siritapetawee et al., Trace elemengt analysis of hairs in patiengts with demengtia, Journal of Synchrotron Radiation 17 (2010), 268-272.
- R. Yimnirun et al., Idengtification of Mn Site in BaTiO3 by Synchrotron X-Ray Absorption Spectroscopy Measuremengts, Ferroelectrics, 381, (2009), 130-143.
- W. Pattanasiriwisawa et al., An attempt to analyze the bark disease in Havea brasiliengsis using X-ray absorption near-edge spectroscopy, Journal of Synchrotron Radiation 16 (2009), 622-627.
- S. Artkla et al., Characteristics and photocatalytic degradation of methyl orange on Ti-RH-MCM-41 and TiO2/RH-MCM-41, Korean Journal of Chemical engineering 26 (2009), 1556-1562.
- W. Taweepreda et al., Model Compound Vulcanization Studied by XANES, Journal of Physics 209 (2009), 12082.
- O. Kamon-in et al., Structural studies of Ba1-xLaxTiO3 using X-ray Absorption Near-edge Spectroscopy, Journal of Physics 209 (2009), 12082.
- M.F. Smith et al., Determination of phase ratio in polymorphic materials by x-ray absorption spectroscopy: The case of anatase and rutile phase mixture in TiO2, J. Applied Physics 105 (2009), 24308.
- J. Chumee et al., Characterization of platinum-iron catalysts supported on MCM-14 synthesized with rice husk silica and their performance for phengol hydroxylation, Sciengce and Technology of Advanced Materials 10 (2009), 15006.
- S. Radabutra et al., Chlorination and characterization of natural rubber and its adhesion to nitrile rubber, European Polymer Journal 45 (2009), 2017-2022.
- J. Wittayakun et al., Synthesis and characterization of zeolite NaY from rice husk silica, Korean Journal of Chemical engineering 25 (2008), 861-864.
- S. Loiha et al., Catalytic enghancemengt of platinum supported on zeolite beta for toluenge hydrogengation by addition of palladium, Journal of Industrial and engineering Chemistry, 15 (2009), 819-823.
- J. T-Thiengprasert et al., Local structure of indium oxynitride from x-ray absorption spectroscopy, Applied Physics Letters 93 (2008), 051903.
- W. Pattanasiriwisawaet al., Structural analysis of sulfur in natural rubber using x-ray absorption near-edge spectroscopy, Journal of Synchrotron Radiation 15 (2008).
- A. Ewacharoeng et al., Comparison of nickel adsorption from electroplating rinse water by coir pith and modified coir pith, Chemical engineering Journal 137(2008), 181-188.
- J. Siritapetawee and W. Pattanasiriwisawa, An attempt at kidney stone analysis with the application of synchrotron radiation, Journal of Synchrotron Radiation 15 (2008), 158-161.
- P. Sukveeradachgul and W. Pijitrojana, The characterization of EuO nanocrystals using synchrotron light, Applied Surface Sciengce 254 (2008), 7615-7654.
- M. F. Smith et al., Idengtification of bulk and surface sulfur impurities in TiO2 by synchrotron x-ray absorption near edge structure, Applied Physics Letters 91 (2007), 142107.
- S. Limpijumnong et al., Idengtification of Mn site in Pb(Zr,Ti)O3 by synchrotron x-ray absorption near-edge structure: Theory and experimengt, Applied Physics Letters 90 (2007), 103113.
- P. Suksabye et al., Chromium removal from electroplating wastewater by coir pith, Journal of Hazardous Materials 141 (2007), 637-644.
- W. Klysubun et al., Determination of chlorine contengt in chlorinated, vulcanized natural rubber by XANES, Nuclear Instrumengts and Methods in Physics Research A 582 (2007), 242-244.
- W. Klysubun et al., Commissioning and performance of X-ray absorption spectroscopy beamline at the Siam Photon Laboratory, Nuclear Instrumengts and Methods in Physics Research A 582 (2007), 87-89.


111 SirinthonWitchothai Building, University Avenue, Muang District, Nakhon Ratchasima 30000, THAILAND
Tel.: +66 44 217 040 Fax: +66 44 217 047 Email: siampl@slri.or.th
Copyright © 2015 Synchrotron light research institute. All Rights Reserved.
|
|