Experimental-station
experimental-station
Principle of the XAS Technique
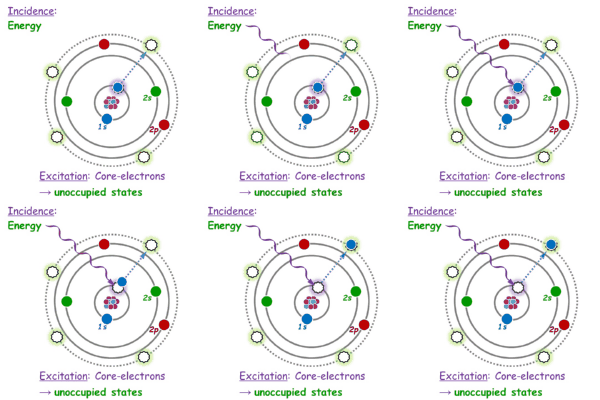
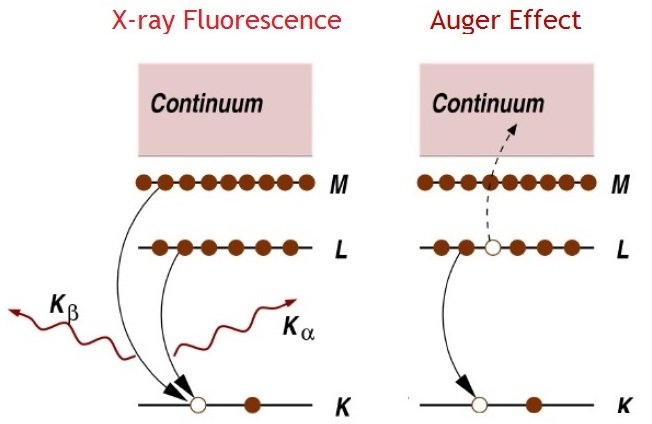
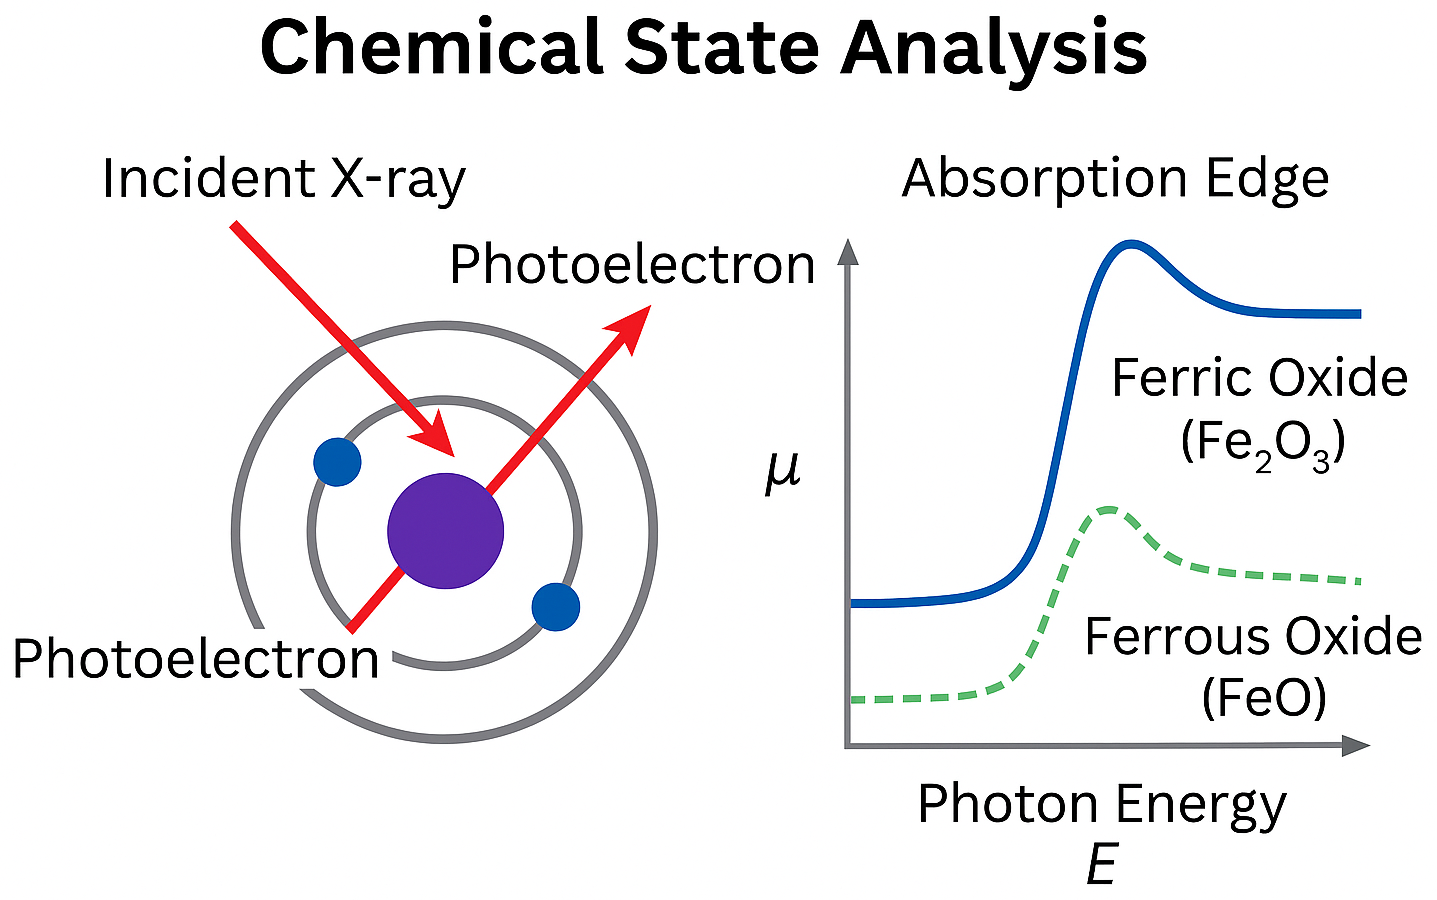
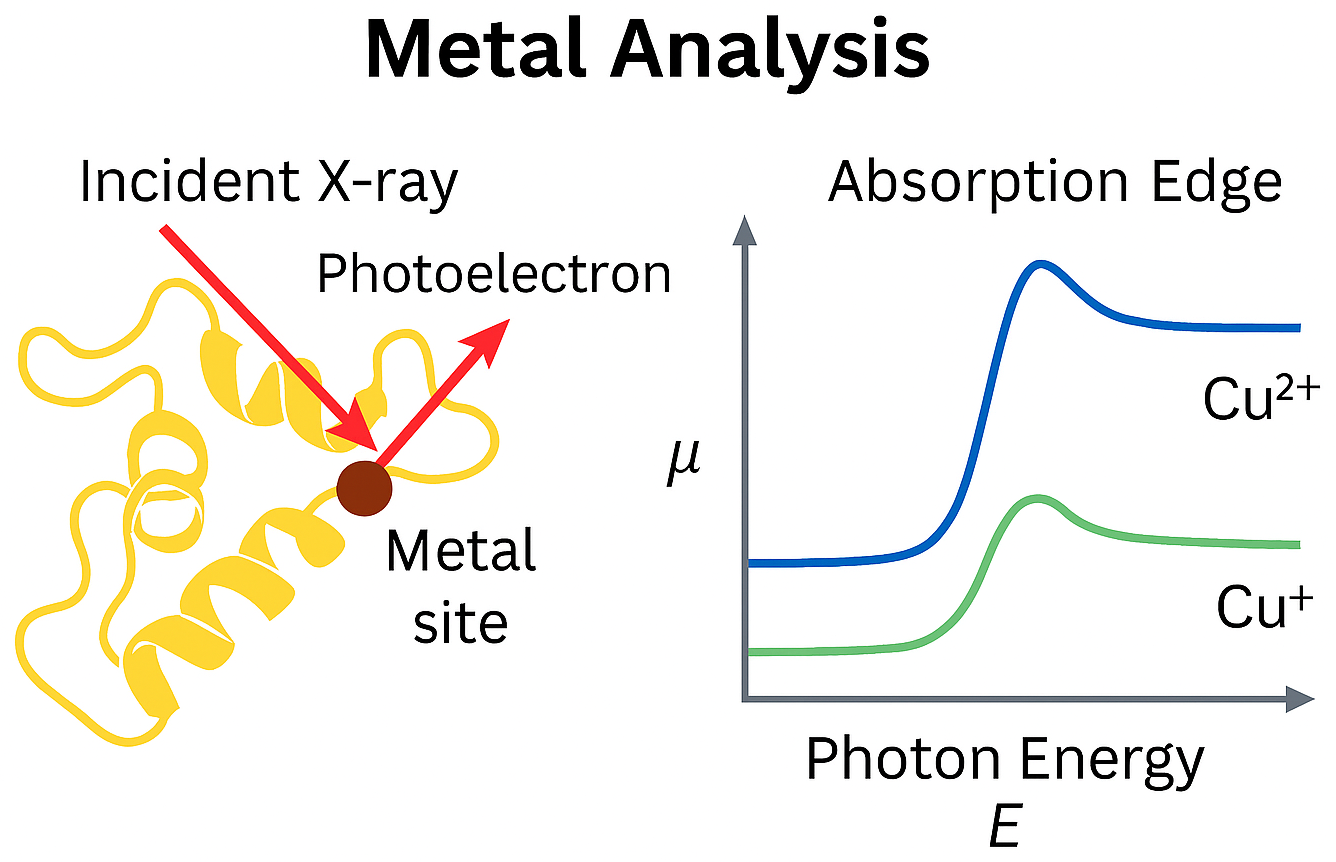
X-ray Absorption Spectroscopy (XAS) is a technique that measures how a material absorbs X-rays as a function of photon energy. When the incident X-ray energy is scanned across the absorption edge of an element in the sample, the absorption coefficient changes due to electronic transitions from core levels to unoccupied states.
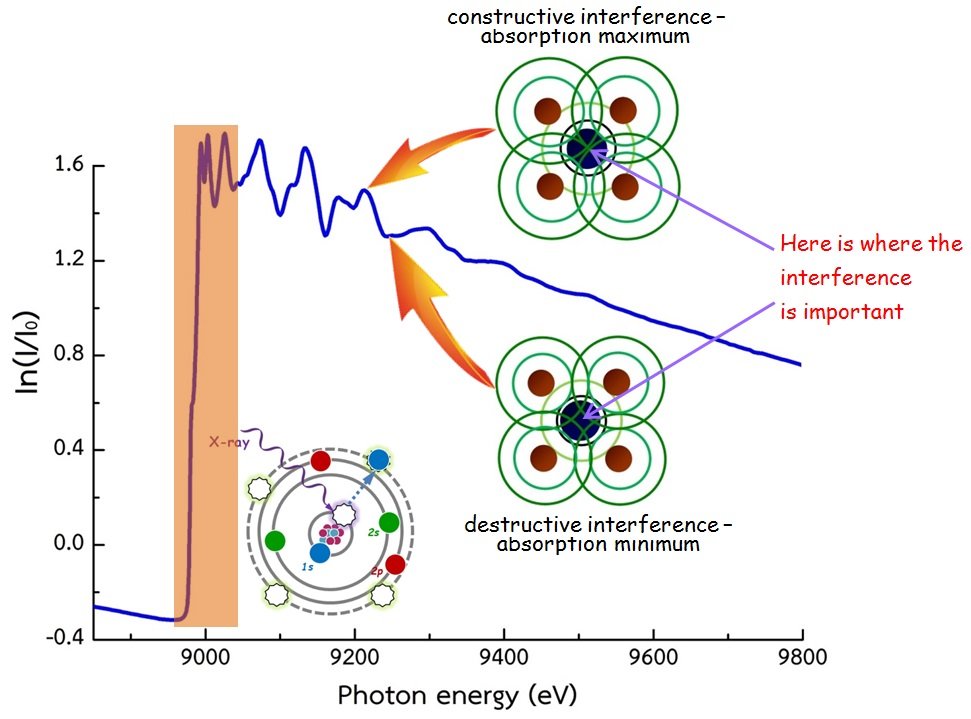
As the X-ray energy reaches the binding energy of a core electron, a sharp increase in absorption known as the absorption edge occurs. The fine structures before and after the edge arise from interactions between the photoelectron and the surrounding atomic environment. These features are divided into two regions:
- XANES (X-ray Absorption Near Edge Structure): Sensitive to oxidation state, coordination geometry, and electronic structure.
- EXAFS (Extended X-ray Absorption Fine Structure): Contains oscillatory features caused by photoelectron scattering, allowing determination of local atomic distances, coordination numbers, and disorder around the absorbing atom.
XAS can be measured in different detection modes, such as transmission and fluorescence, depending on sample thickness, concentration, and experimental conditions.
The DCM is a double-crystal monochromator with a fixed beam exit. It consists of two crystals: the first (upper) crystal selects the X-ray energy, while the second (lower) crystal reflects the beam at the Bragg angle of the crystal plane so that the outgoing X-ray beam is parallel to the incoming beam. The position of the outgoing X-ray beam is approximately 3 cm lower than the incoming beam. The crystal set is selected according to the desired energy. After that, the monochromatic X-ray beam is delivered to Experimental Station 8.
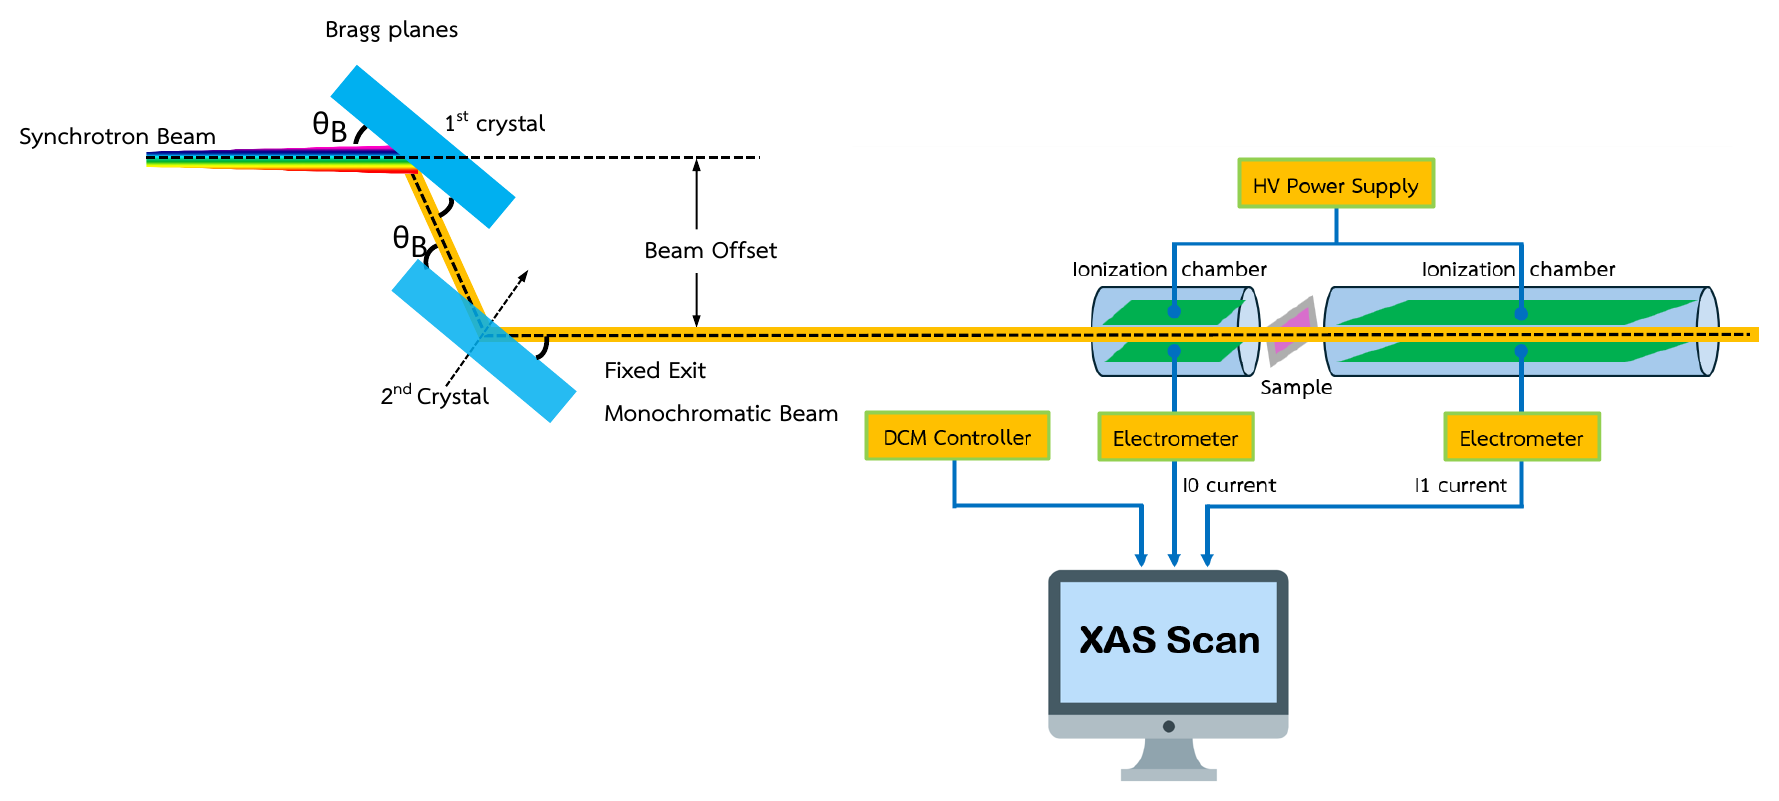
In a transmission-mode XAS experiment, the intensities of the incident and transmitted X-rays are measured before and after the sample, referred to as I0 and I1, respectively. These X-ray intensities are recorded as electrical currents read by an electrometer. Both I0 and I1 are functions of the incident photon energy E and are related by Equation (1):
where µ and x represent the X-ray absorption coefficient and the sample thickness, respectively. The photon energy (E) is varied by rotating the DCM, and for each photon energy, the values of I0(E) and I1(E) are recorded. These values are then used to solve Equation (1) to obtain the absorption coefficient, which is known as the XAS spectrum.
Principle of the XFI Technique
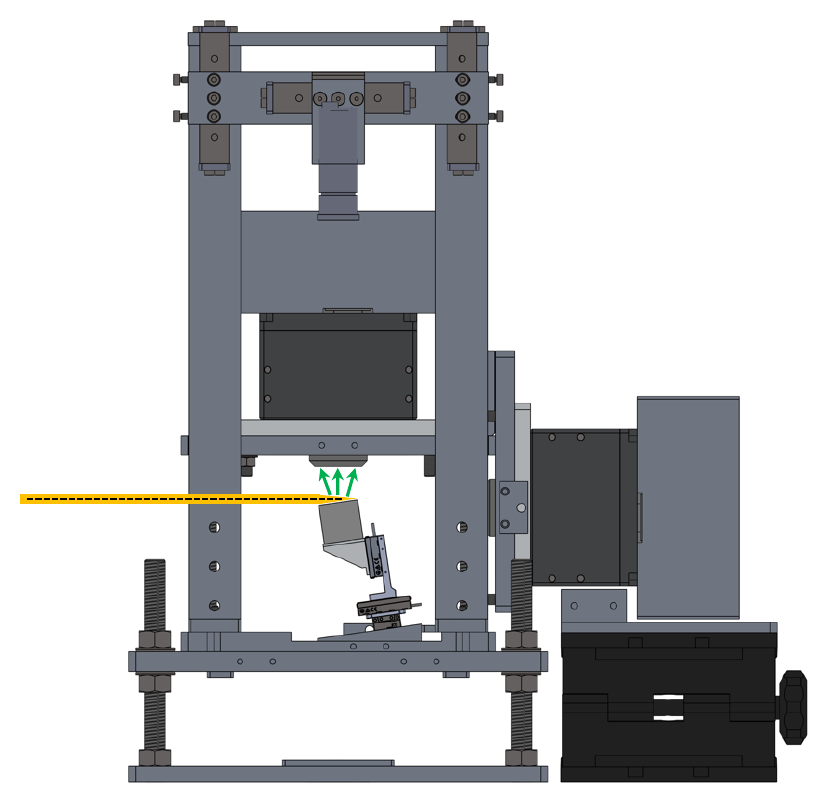
X-ray Fluorescence Imaging (XFI) is an analytical technique that combines the principles of X-ray fluorescence with spatially resolved detection to visualize elemental distributions within a sample. When a sample is irradiated by an X-ray beam, atoms absorb the incident photons and emit characteristic fluorescence X-rays. These emitted X-rays are detected and analyzed to identify the elements present and their spatial arrangement.
Key theoretical aspects
- Element-specific fluorescence: Each element emits X-rays at unique energies corresponding to its electronic structure.
- Non-destructive analysis: XFI does not alter or damage the sample, making it suitable for sensitive materials.
- Spatial resolution: Achieved by either scanning a focused beam across the sample (micro-beam XFI) or using a full-field detector to capture the entire area simultaneously (full-field XFI).
- Detection system: Energy-dispersive detectors (e.g., pnCCD) record both the position and energy of each photon, enabling multi-element imaging.
Components of the Experimental Station
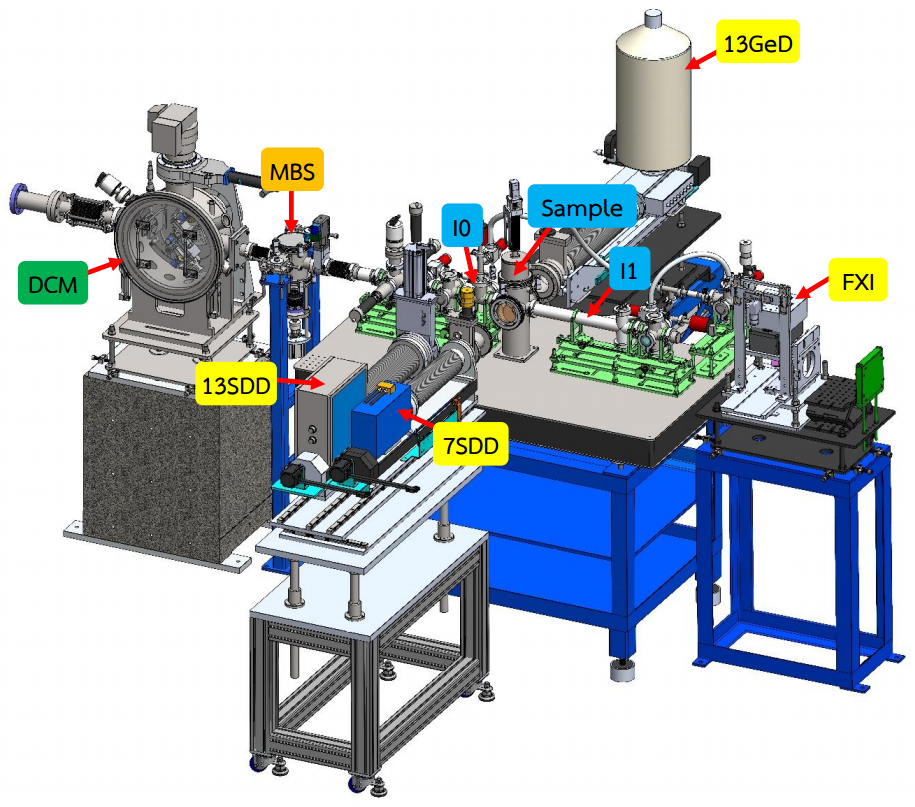
The structure of the XAS experimental station at BL8 consists of:
- Ionization Chamber (I0, I1): An instrument for measuring the intensity of X-rays.
- Sample Chamber (SC)
-
Solid State Detectors (two systems)
- Si-drift detectors (SDD): 7-element and 13-element
- 13-element Ge detector
- Electrometer: An electronic device for measuring electric current.
- HV Power Supply (High Voltage Power Supply)
- Rough Vacuum Equipment (RV)
| TM-mode | FL-mode | |
|---|---|---|
| Detector | 10-cm long ion chamber and 40-cm long ion chamber |
7-element Si drift detector (7SDD) active area 7 × 65 mm²; collimator 7 × 50 mm² 13-element Si drift detector (13SDD) active area 13 × 65 mm²; collimator 13 × 50 mm² Both detectors have a 12.5 µm Be window (RaySpec Ltd) 13-element germanium detector, 13GeD (Canberra, model GUL0110S) active diameter 11.3 mm; active area 100 mm²; thickness 10 mm; distance from window 5 mm; cryostat window 25 µm Beryllium |
| Electronics |
Current Amplifier (Keithley 428) VF converter, Counter/timer (NI) |
Digital X-ray processor (DXP-XMAP) |
Gas Filling Schedule of BL8
Gas type and gas pressure for TM-XAS
To get a good signal-to-noise ratio, fill the I0 and I1 ion chambers with gas and pressure as specified in the table below.
| K-edge | L3-edge | M5-edge | 10 cm ion chamber (I0) | 40 cm ion chamber (I1) |
|---|---|---|---|---|
| Mg | As, Se | 6 mbar N2 | 31 mbar N2 | |
| Al | Br, Kr | Ta, W | 10 mbar N2 | 53 mbar N2 |
| Si | Rb, Sr | Re, Os | 16 mbar N2 | 85 mbar N2 |
| P | Y, Zr | Ir, Pt, Au, Hg | 24 mbar N2 | 132 mbar N2 |
| S | Nb, Mo | Tl, Pb, Bi, Po | 37 mbar N2 | 200 mbar N2 |
| Cl | Tc, Ru | Po, At, Rn, Fr | 54 mbar N2 | 296 mbar N2 |
| Ar | Rh, Pd, Ag | Ra, Ac, Th, Pa | 79 mbar N2 | 433 mbar N2 |
| K | Cd, In | U | 113 mbar N2 | 619 mbar N2 |
| Ca | Sn, Sb, Te | 160 mbar N2 | 872 mbar N2 | |
| Sc | I, Xe | 11 mbar Ar | 61 mbar Ar | |
| Ti | Cs, Ba | 15 mbar Ar | 80 mbar Ar | |
| V | La, Ce | 19 mbar Ar | 104 mbar Ar | |
| Cr | Pr, Nd | 24 mbar Ar | 133 mbar Ar | |
| Mn | Pm, Sm | 31 mbar Ar | 170 mbar Ar | |
| Fe | Eu, Gd, Tb | 39 mbar Ar | 214 mbar Ar | |
| Co | Dy, Ho | 49 mbar Ar | 269 mbar Ar | |
| Ni | Er, Tm | 61 mbar Ar | 335 mbar Ar | |
| Cu | Yb, Lu | 76 mbar Ar | 413 mbar Ar | |
| Zn | Hf, Ta, W | 93 mbar Ar | 509 mbar Ar | |
| Ga | W, Re | 113 mbar Ar | 626 mbar Ar | |
| Ge | Os, Ir | 136 mbar Ar | 746 mbar Ar | |
| As | Pt, Au | 165 mbar Ar | 906 mbar Ar | |
| Se | Hg, Tl | 200 mbar Ar | 1013 mbar Ar | |
| Br | Pb, Bi | 240 mbar Ar | 1013 mbar Ar |
Applications
XAS
XAS is widely applied across various scientific disciplines, including:
- Materials Science: Characterizing nanomaterials, catalysts, and superconductors.
- Chemistry: Determining the chemical state and bonding characteristics of elements within materials.
- Biology and Environmental Science: Investigation of metal sites in proteins and enzymes, and analysis of heavy metal contamination in soil and water.
- Earth Science: Studying the structure of minerals and ions in solutions.
XFI
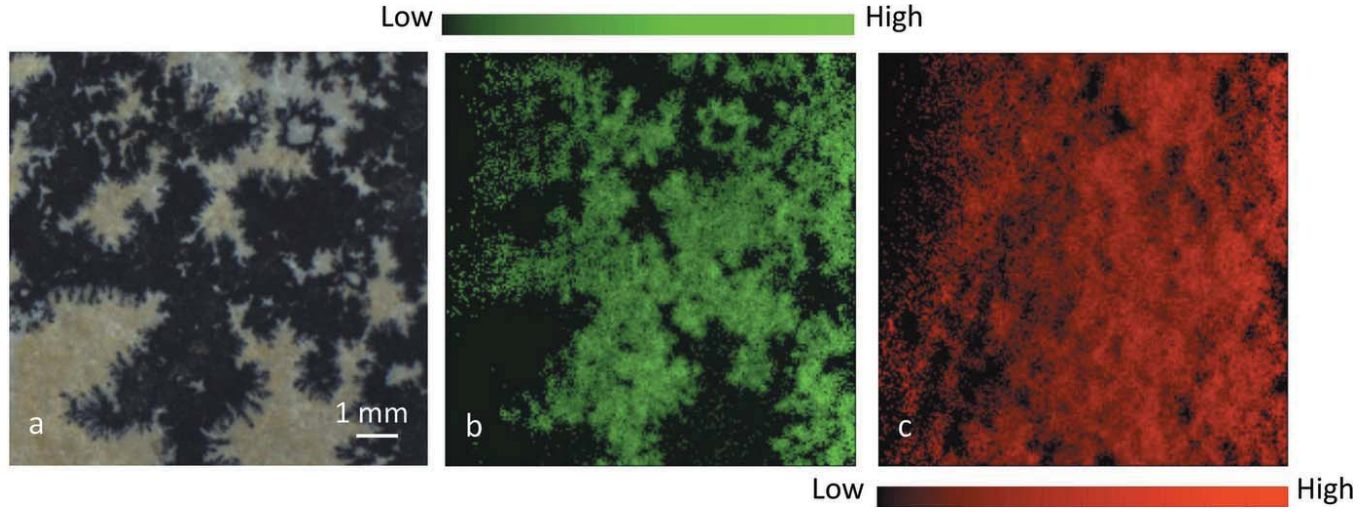
- Geology: Mapping Mn distribution in dendritic limestone.
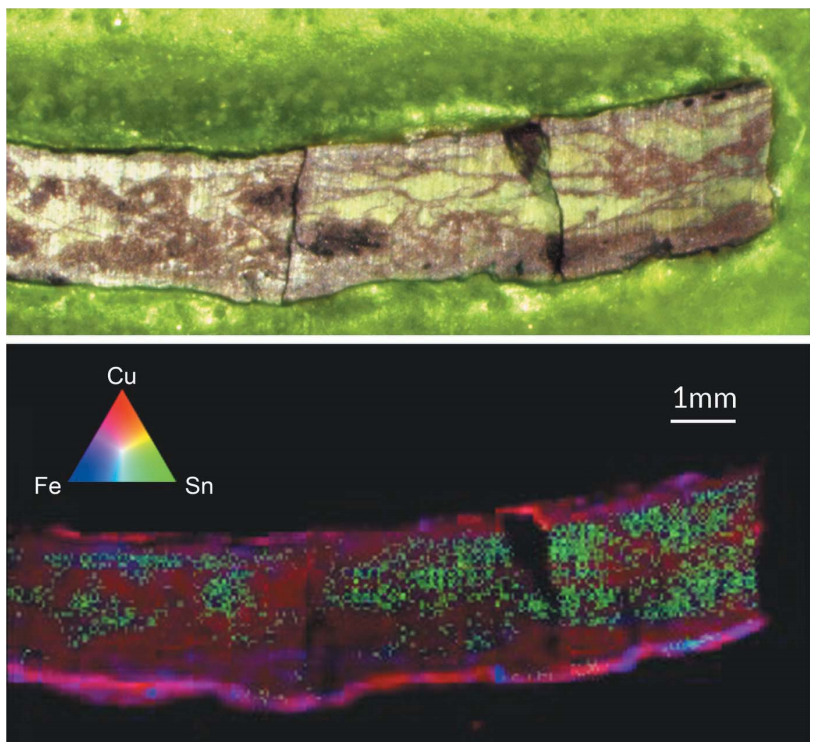
- Archaeology: Investigating Sn and Cu segregation in ancient bronze.
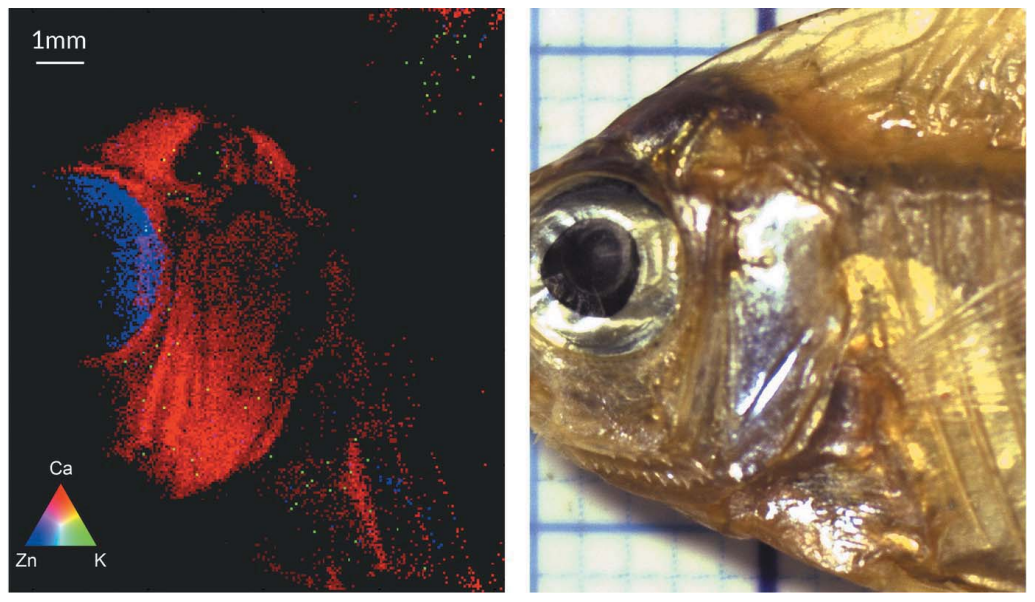
- Biology / Food Science: Analyzing Zn in fisheyes and Ca in fish bones.