Blog

  • Beamline Operation

    Beamline Operation

    Beamline Operation

    Safety Guidelines for Operating BL2.2

    IMPORTANT: Users must be aware of local restriction before using BL2.2

    All users must strictly comply with the safety regulations and operational procedures of the Synchrotron Light Research Institute (SLRI). Operation of Beamline 2.2 (BL2.2) is permitted only for trained and authorized personnel.

    • Only users who have received authorization from the beamline scientist or safety officer are allowed to operate the beamline. The user must sign on SOP form before expiremental performing at BL2.2.
    • Users must wear the provided OSL radiation badges (Optically Stimulated Luminescence dosimeters) at all times within the experimental hall.
    • Entry to the experimental area is strictly prohibited during beam injection or operation.
    • Any malfunction or abnormal condition related to radiation safety must be reported immediately to the beamline staff.
    • Food and beverages are not permitted inside the beamline station.
    • Users must maintain a clean and organized work area throughout the experiment.
    • At the conclusion of beamtime, all personal materials and samples must be removed, and the beamline area must be cleaned and restored to its original condition.

    Personnel Safety Interlock (PSI) System

    PSI System protects workers from immediate radiation by preventing them from accessing beam enclosures and other locations where there is a risk of high radiation exposure. It consists of mechanical barriers and locks as well as electronic interlocks. The interlocks also serve to turn off the radiation source if any of the interlocked barriers entering the beam enclosures are broken.
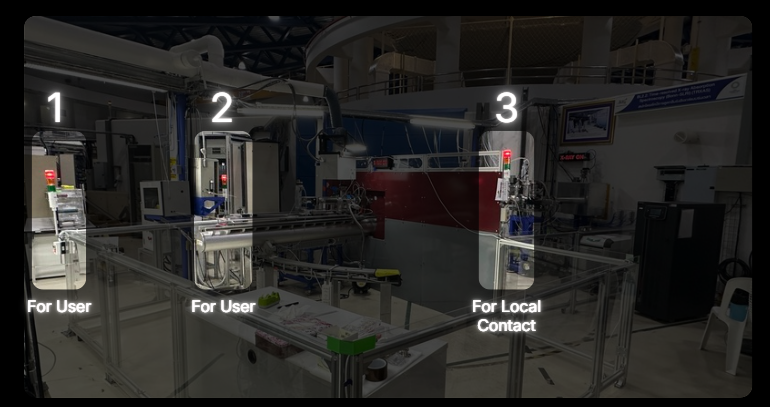
    Closing the Hutch Door

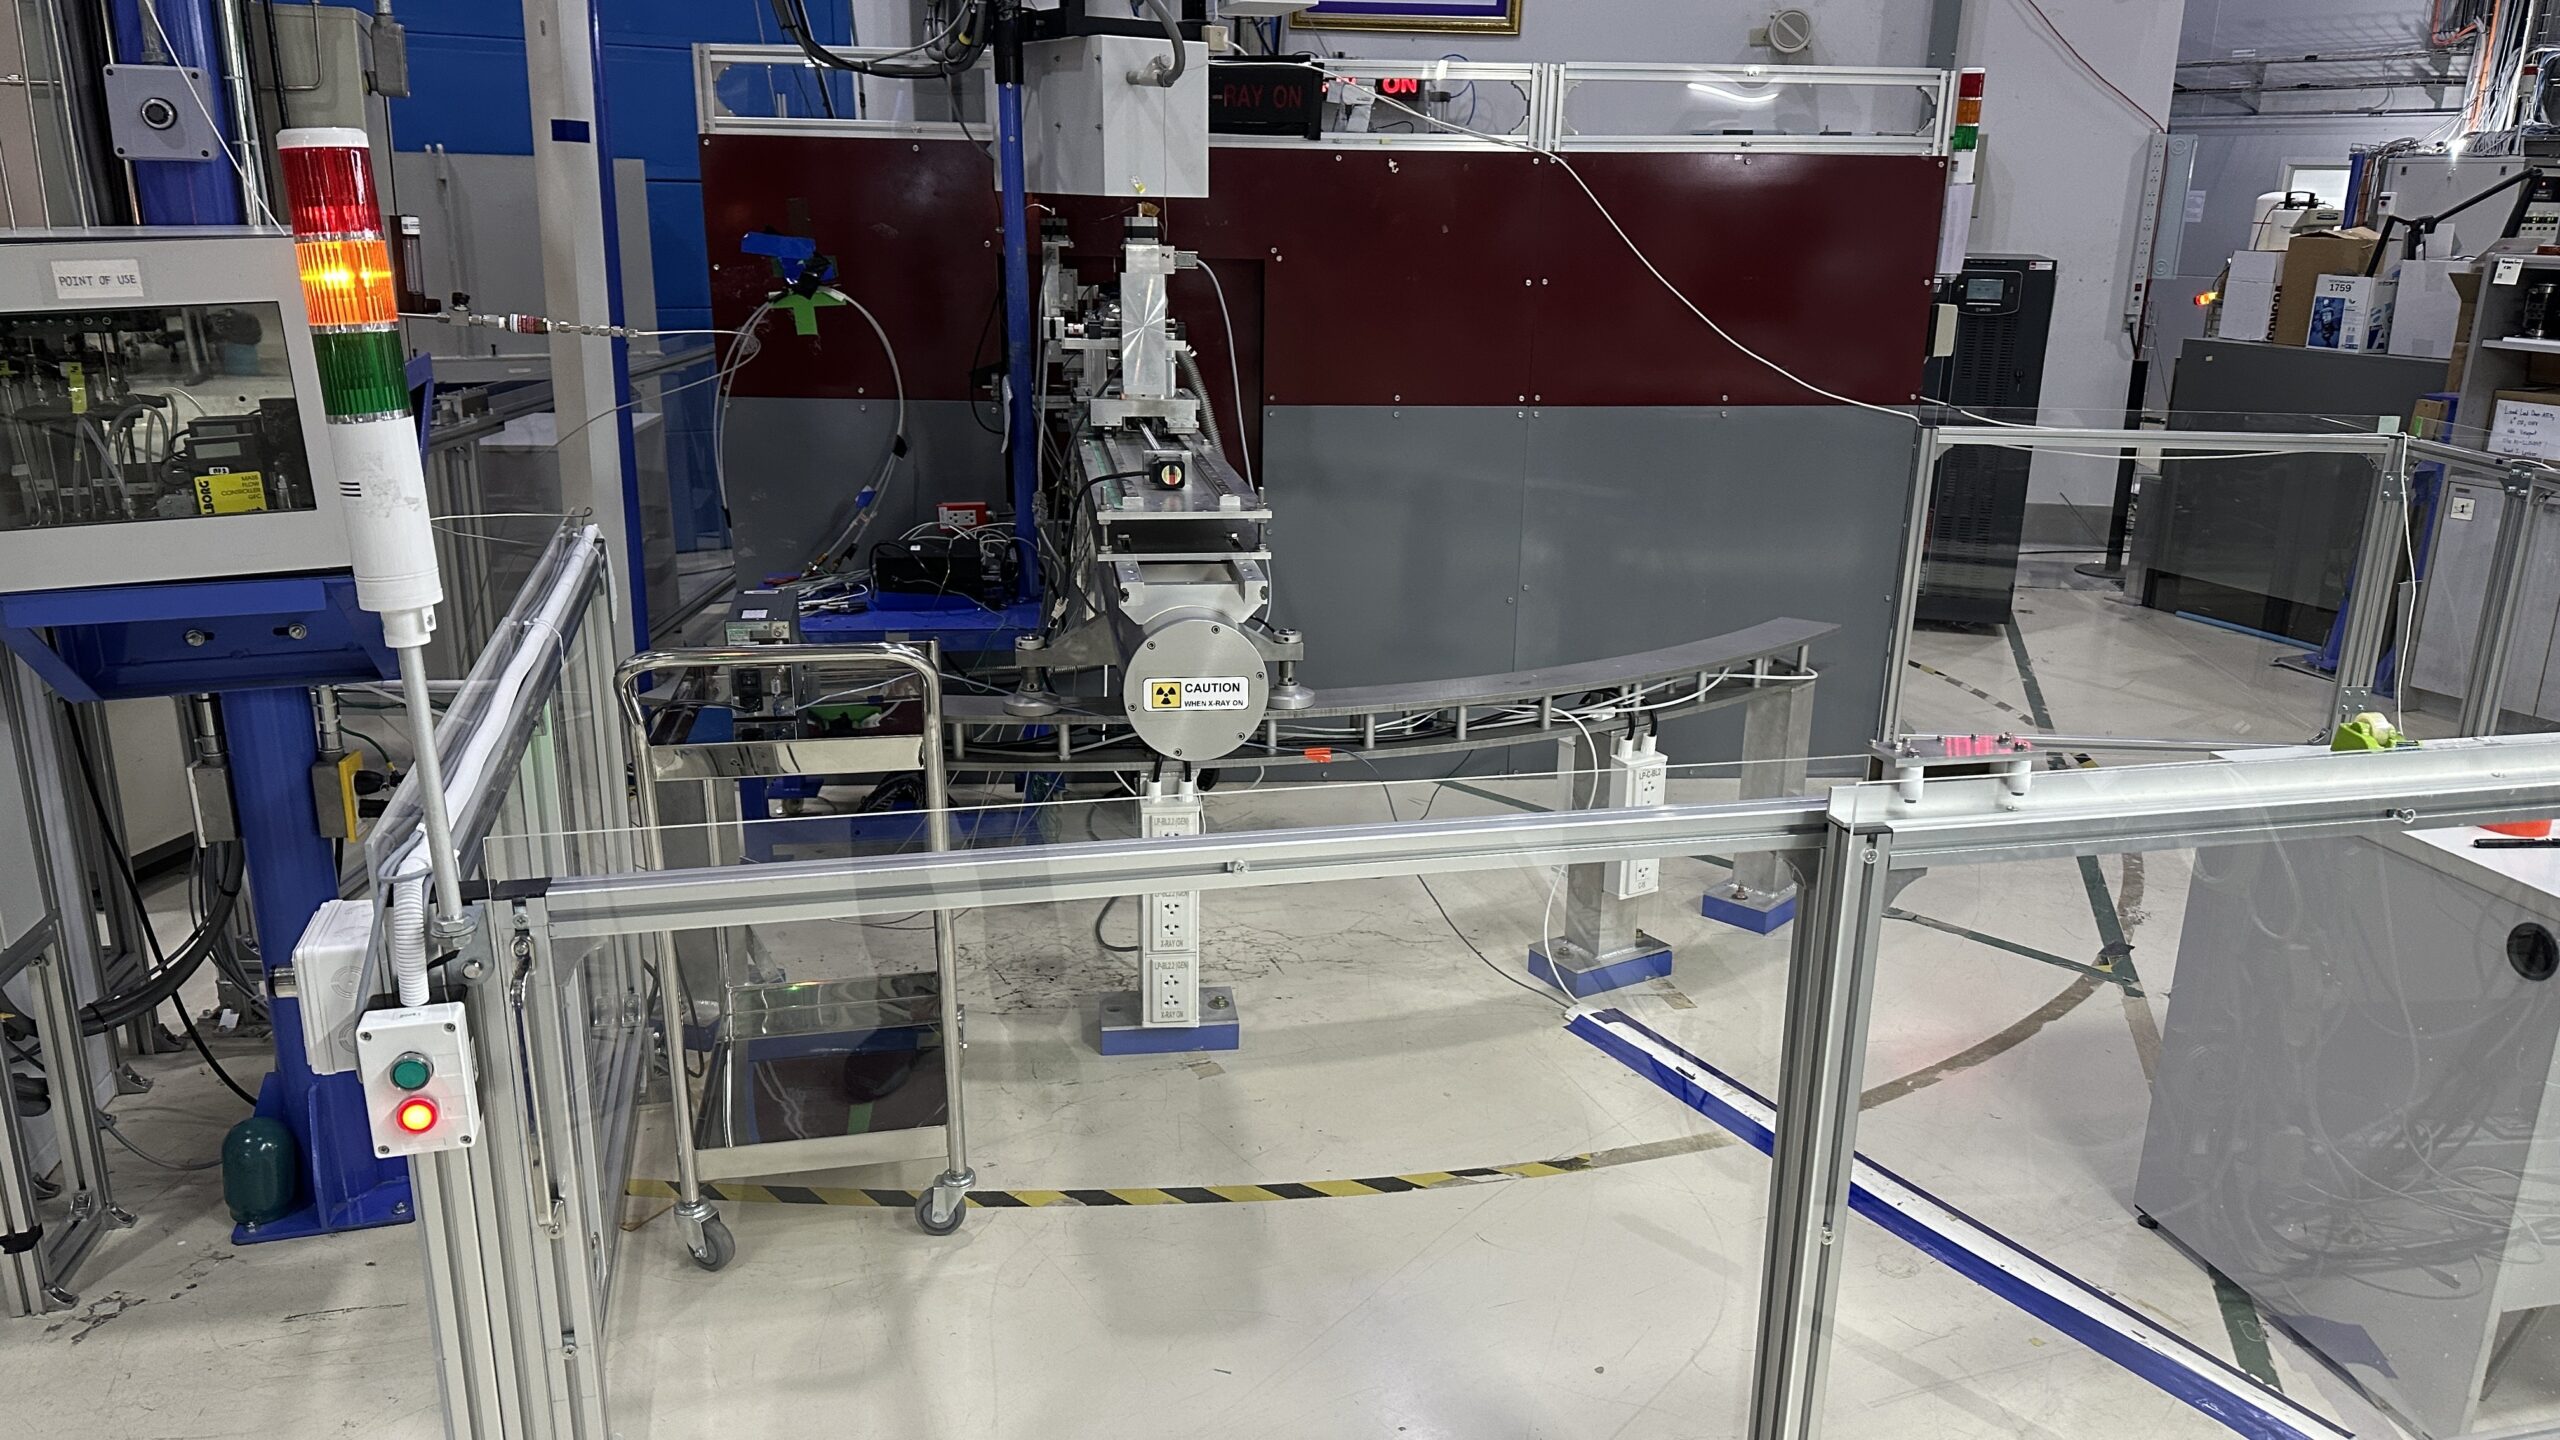
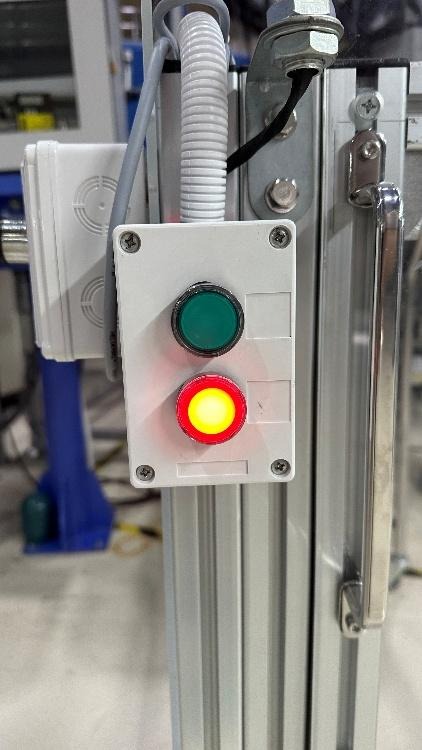
    1. Press the red button, then slide the door closed. The tower light will change from green to yellow.*
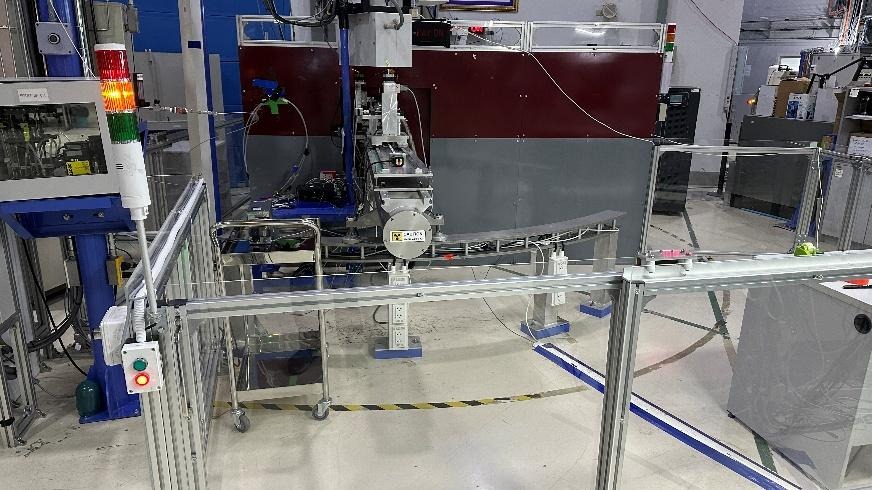
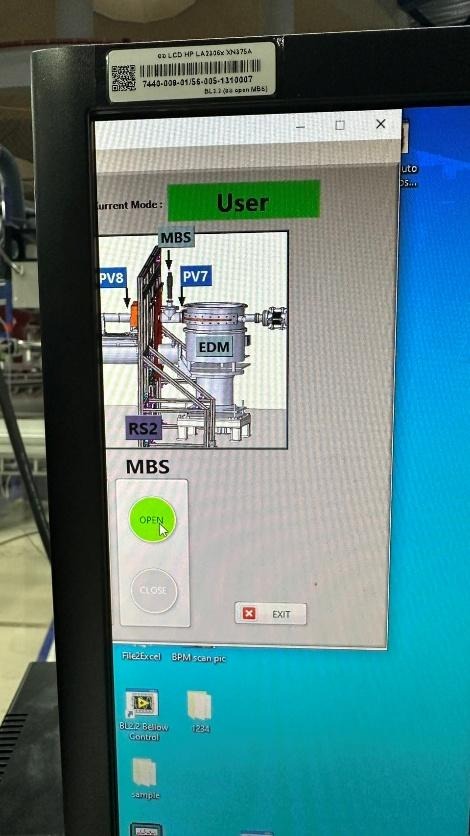
    1. Open the shutters at positions MBS in the Interlock Beamline 2.2 program.
    1. Once the door is opened, the tower light will change from yellow to red, indicating that the area is restricted.
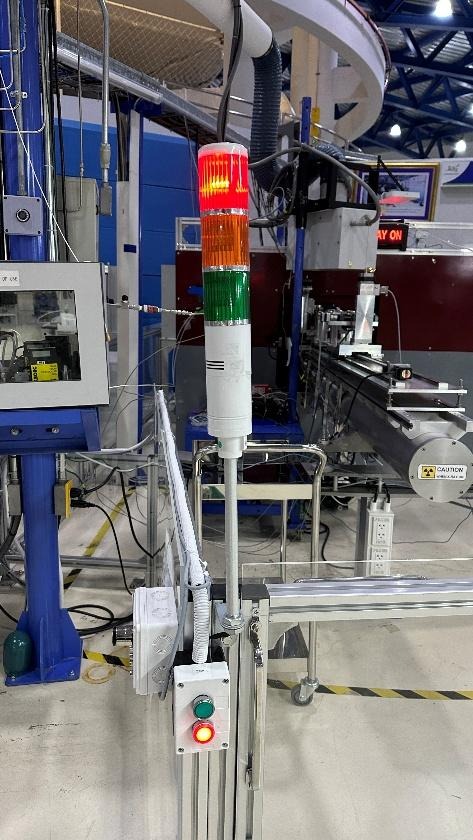
    *Note: If the light does not turn yellow, it indicates that the magnetic sensors on the door are not aligned.

    Solution: Press the green button, slightly slide the door open, and repeat Step 1.

    Opening the Hutch Door

    1. Close the MBS shutters in the Interlock Beamline 2.2 program.
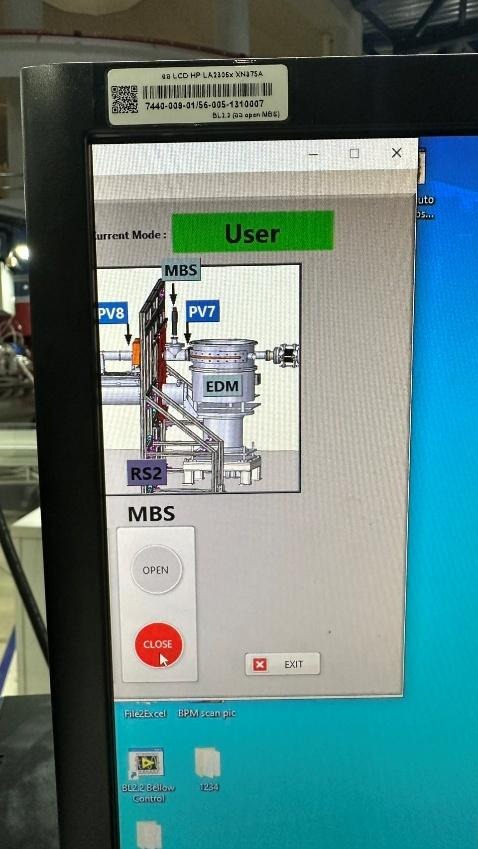
    1. The tower light will change from red to yellow.
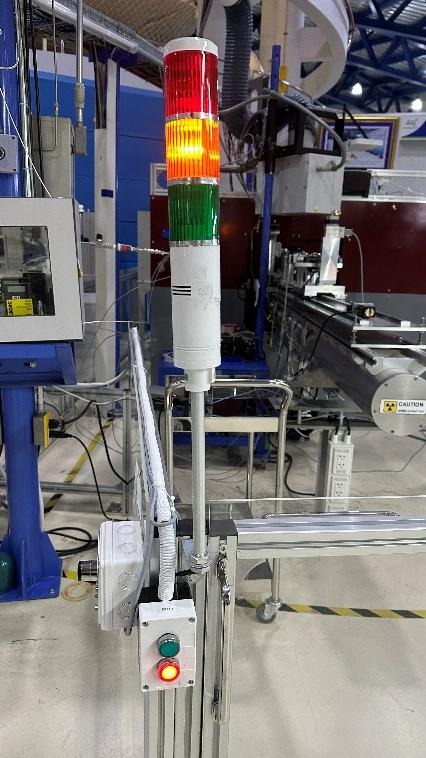
    1. Walk to the door control panel and press the green button to unlock the door.

    The tower light will change from yellow to green.

    Then slide the door open and enter the experimental area.
    Beamline Manual

    1. Sample Preparation
      1. Pellet Preparation
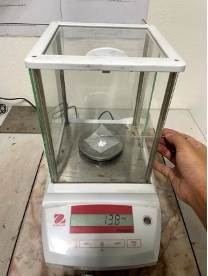
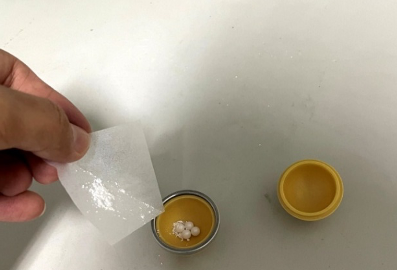
        1. Weigh the sample and Boron Nitride (BN) so that their combined weight falls within a range of 20 ± 2 mg. For example, if you weigh 3 mg of the sample, you should weight 15 mg of BN. Transfer both the sample and the BN into the grinding jar. 

    Recommendation: Place the grinding balls into the jar before pouring the powders in; this helps prevent the powder from dispersing or spilling out of the container.
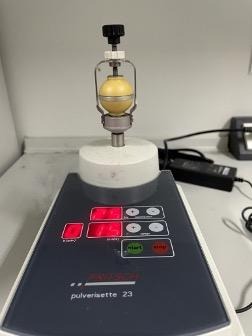
    1. Mix the substances using a ball mill. Place the grinding jar between the clamping brackets and hand-tighten the locks at points A and B to ensure the jar remains secure. This prevents the grinding jar and balls from dislodging due to high-frequency vibration and extended operating time. Set the oscillation frequency to 25 Hz and the mixing time to 15 minutes.
    1. Once the time has elapsed, release the locks at points B and A. Use a stainless steel spatula to scrape off any material adhering to the surfaces of the grinding balls and the inner walls of the jar.
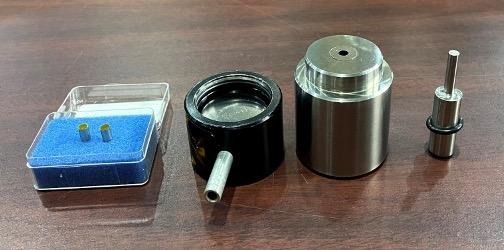
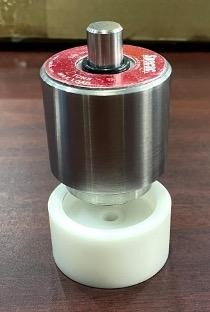
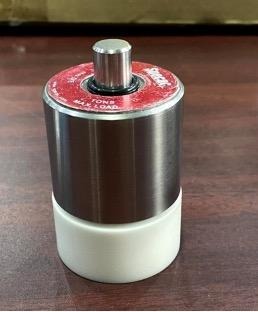
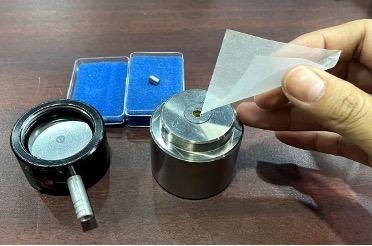
    1. Pour the scraped powder into the 5 mm pellet die set. The assembly order of the die components and the sample is shown in the figure.

    Recommendation: Pour the powder from the bottom of the die, as the distance to the pressing face is shorter than pouring from the top, which minimizes material loss.
    1. Place the die set into the pellet press to compress the powder. Apply a pressure of 1 Ton and maintain it for 45 seconds.
    2. Remove the die set from the press and disassemble it.
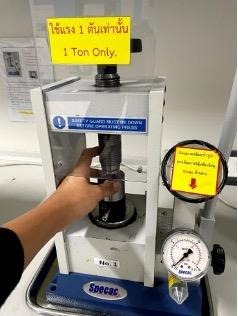
    Recommendation: Use a Teflon support base with a 5 mm center hole to hold the die while ejecting the sample. This reduces impact and prevents the pellet from popping out and getting lost. If the pellet remains stuck, place the Teflon base and die set back into the press and gently turn the top handle to apply steady pressure instead of using manual force. This method protects the die set from bending or damage caused by sudden impacts.

    The resulting 5 mm pellet should be circular, with no chipped edges, cracks, or fractures.

    Recommendation: Always verify the spectral quality of the prepared sample before installing it in the heating cell (as detailed in Section 5).

    1. Sample Loading Procedure for the Heating Cell
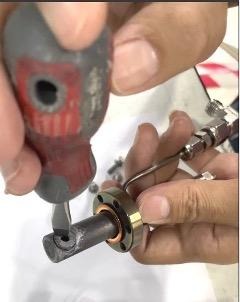
      1. Place the experimental sample into the cell holder. Use a flat-head screwdriver to tighten and secure the sample. Verify that the sample is firmly held in place by gently shaking the cell holder back and forth.
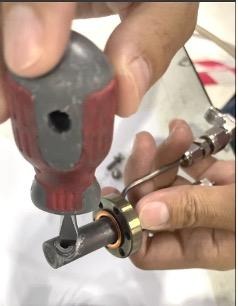
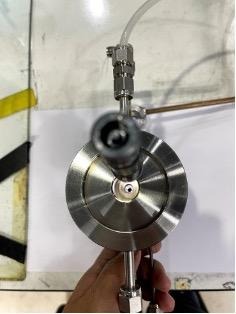
    1. Insert the cell holder into the heating cell using a DN16 Gasket as a seal. Secure the cell holder to the heating cell using six M4 bolts. Ensure the sample is positioned exactly in the center of the heating cell; verify this by shining a light inside and inspecting it from the top view of the heating cell.
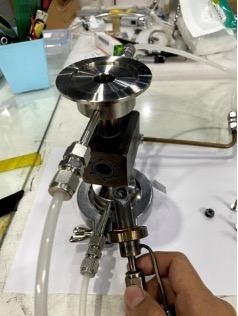
    1. Once secured, perform a leak test on the heating cell using SNOOP leak detector in conjunction with nitrogen gas. If the six bolts are not sufficiently tightened, bubbles will appear during the test. Continue to tighten the bolts until no more bubbles are observed.
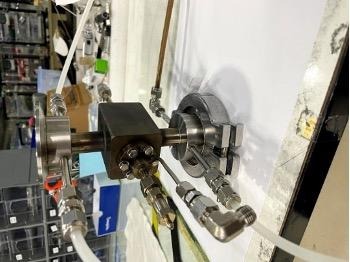
    1. After passing the leak test, proceed to install the heating cell at the experimental station (beamline).
    1. Installation of the Heating Cell to the Experimental Station
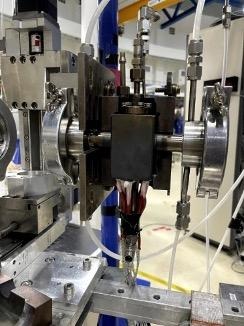
      1. Heater Installation The heating cell features six slots for cartridge heaters. Insert the cartridge heaters firmly into the designated holes. Secure them by wrapping with cloth duct tape to prevent the heaters from slipping out of the cell.
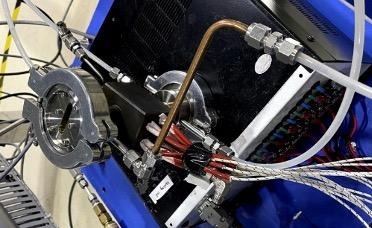
    1. Mounting the Cell Proceed to install the heating cell at the experimental station. Use the cell cover to enclose the heating cell; this ensures stable heat distribution and allows the cell to reach high temperatures efficiently.
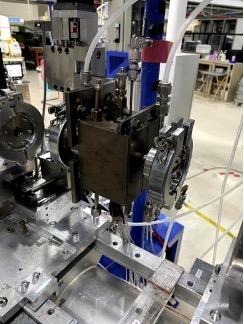
    1. Connections and Cooling Insert the thermocouple into the heating cell. Connect the water inlet and outlet hoses to facilitate the cooling of the heating cell system.
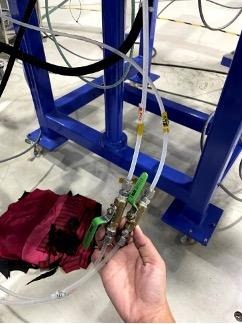
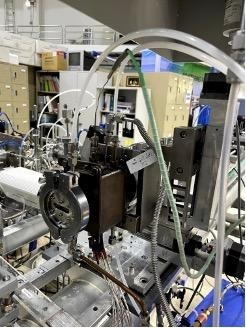
    Note on Water Lines: Carefully observe the symbols for the water lines. Ensure the “Inlet” is connected to the inlet hose and the “Outlet” is connected to the outlet hose. Do not swap the connections.

    1. System Setup Under Thermal Conditions

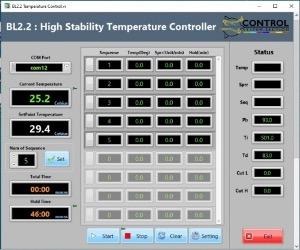
    The system is operated via a control box and the Temperature Controller software. The control box manages the interaction between the heaters and the thermocouple based on software commands. Users can define the heating profile using the BL2.2 Temperature Controller software, which allows for the setting of target temperatures, ramp rates, and dwell times for up to 999 steps.

    1. Turn on the main switch on the Temperature Control Box (Switch No. 1).
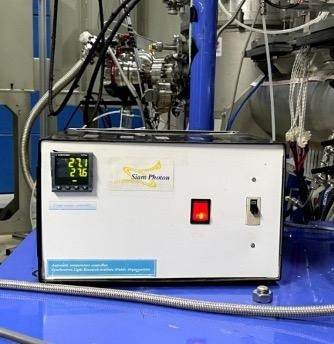
    1. Open the BL2.2 High Stability Temperature Controller software. The interface includes the following settings:
    ParameterDescription
    Num of SequenceTotal number of steps in the experiment.
    SequenceThe specific step number currently being edited.
    Temp (Deg)The target temperature for that step.
    Sprr (Unit/min)The heating rate (Set Point Rise Rate).
    Hold (min)The duration to maintain (soak) at that temperature.
    1. Once all sequences are programmed, Click Start in the software. Lift the safety breaker (Cut-out) on the control box (No. 2) to begin the thermal cycle.
    2. Once the experiment is complete, Click Exit at the bottom-right corner of the software. Turn off the main switch (No. 1). Pull down the safety breaker (No. 2).
    1. System Setup Under Gas Conditions

    The station provides various gases, including H2 ​,N2 ​,Ar ,He ,O2 ​,CO2 ​, and flammable gases. The flow rate is regulated via a gas control box and dedicated Mass Flow Controller (MFC) software.

    Safety Note: To prevent hazards during atmospheric experiments, gas leak sensors are installed at both the gas cylinder storage area and the experimental station.

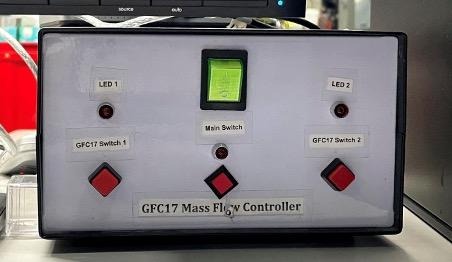
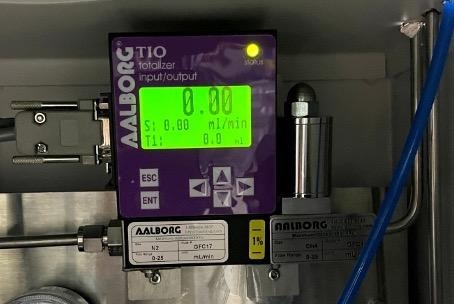
    1. Turn on the gas flow control box using the main power switch. The switches on the control box function as follows:
      • Switch No. 1: Main power for the Gas Flow Control Box.
      • Switch No. 2: Controls the operation of Hydrogen (H2​) and Oxygen (O2​).
      • Switch No. 3: Controls the operation of Nitrogen (N2​), Helium (He), and Argon (Ar).
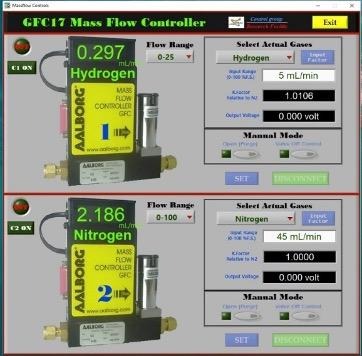
    1. Open the Mass Flow Controls program. The software interface consists of the following parameters:
    ParameterDescription
    C1Controls the flow rate for Hydrogen and Oxygen.
    C2Controls the flow rate for Nitrogen, Helium, and Argon.
    Flow RangeSets the maximum range (0-100 ml/min).
    Note: For Hydrogen, the Flow Range must be limited to 0-25 ml/min only.
    Select Actual GasesChoose the specific gas being used for the experiment.
    Input RangeEnter the desired flow rate value.

    Note: Once the flow rate is set, the K-factor and Output Voltage values will be calculated and displayed automatically.

    1. To Start: After entering the desired flow rates, click SET to begin the gas flow.

    To Shutdown: Once the experiment is complete, click DISCONNECT.

    A confirmation prompt will appear: “Are you sure you want to close GFC17 software?” Click YES.

    Turn off the switches on the control box.

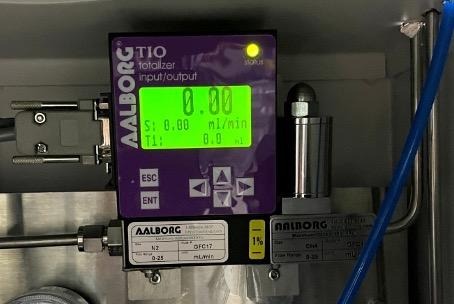
    1. Methane flow is controlled manually directly on the flow control device:

    Press ENT; the cursor will begin to blink on the digits.

    Use the Up/Down arrow keys to increase or decrease the value.

    Press ENT again to confirm the setting and begin the flow.
    1. XAS Spectrum Recording
      1. Open the C557-01APL program as shown in the figure.
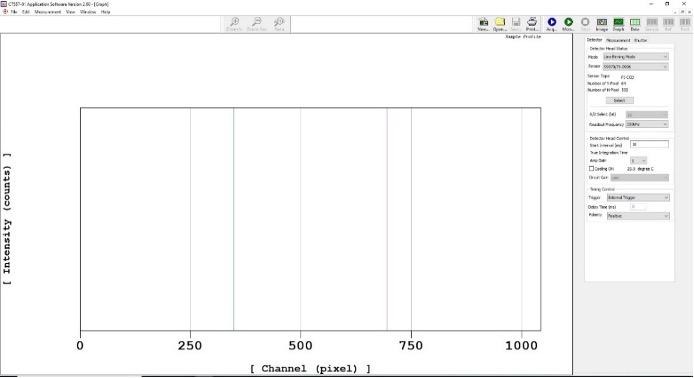
    1. Detector Configuration On the Detector window, navigate to Detector Head Status and select s3903/048381-1024. Click Select, then click OK.
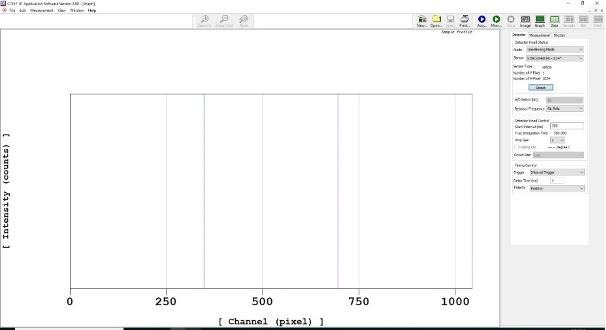
    1. Acquisition Timing Define the data acquisition time in milliseconds by entering the value in the Start Interval (ms) field.
    2. Measurement Settings On the Measurement window, configure the following settings:
      1. Set Measurement Control to Single shot measurement.
      2. Specify the number of spectra to be measured in the Number of field.
      3. Check the box for Averaging ON.
      4. Select Software Averaging to allow the system to average multiple scans into a single spectrum.
    3. XAS Measurement Procedure (TRXAS Station) The X-ray absorption measurement requires separate recordings for I0​ (incident intensity without sample) and I1​ (transmitted intensity through the sample). Follow these steps:
    4. Recording the I0​ Spectrum (Background)

    In the Acquired Mode menu, select Dark Acquired and click Acq. The dark current spectrum will appear on the right side of the screen.

    1. Open the MBS (Main Beam Shutter) to allow X-rays into the experimental station.

    Select Sample Acquired, ensure Dark Calibration ON is checked, and click Acq.

    Once the measurement is complete, Close the MBS.

    Save the I0​ spectrum: Go to File > Save as, enter the filename, select the file type as .txt, and click Save.

    1. Recording the I1​ Spectrum (Sample)

    Mount the sample onto the Holder as shown in the figure. Repeat the steps outlined in section 1
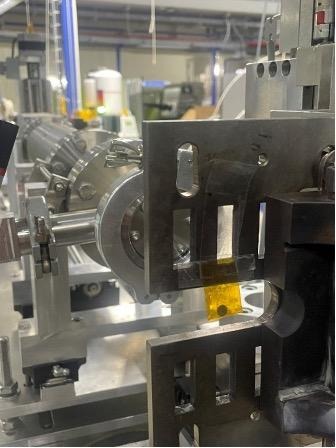
    Note: It is recommended to perform a trial measurement before inserting the sample into the actual heating cell. This is to verify that the sample thickness/concentration provides an appropriate Edge Jump for the experiment.

    Once both I0​ and I1​ spectra are obtained, proceed to the data processing stage.

    1. Data Analysis

    The Time-resolved X-ray Absorption Spectroscopy (TRXAS) technique at the Synchrotron Light Research Institute measures the X-ray absorption of specific elements. By utilizing an NMOS linear image sensor, the system can simultaneously record X-rays across all energy levels remaining after absorption. This capability significantly reduces the acquisition time per spectrum to less than 100 milliseconds.

    A TRXAS dataset typically consists of two primary spectra:

    I0: The measurement of the X-ray beam intensity without the sample.

    I1: The measurement of the X-ray beam intensity with the sample present.

    These values are used to calculate the X-ray absorption, which is proportional to ln(I0​/I1​). Since the raw spectra are initially recorded in pixels, they must be calibrated into actual energy values.

    Data Workflow

    The data processing procedure is divided into two main stages:

    1. Preprocessing Data: Converting raw data files into a format compatible with the Athena software.
    2. Athena Processing: Performing the pixel-to-energy calibration.

    Once these steps are completed, the resulting spectra are ready for detailed analysis and further scientific interpretation.

    The Demeter software package (ATHENA) is free and open-source.

    It can be downloaded from the official website. [click here]

    Link: https://bruceravel.github.io/demeter/?utm_source=chatgpt.com

    1. Data Backup
      1. Data Retrieval and Backup after Experiments at BL2.2

    After completing your experiment at Beamline 2 (BL2.2), all data generated during your session, including raw spectra, scan logs, and experimental parameters  are stored automatically on the beamline local data server. The following steps outline how users can retrieve and back up their data at the Synchrotron Light Research Institute (SLRI).

    1. Data Storage

    During the experiment, all files (including scan data, configuration files, and experimental logs) are saved on the beamline control computer and mirrored to the local BL8 data server. Data are organized under folders named by Proposal ID or Experiment Date BL2.2 data are stored temporarily, typically up to 30 days after your beamtime, before being moved to archive storage or deleted to make space for new experiments.

    1. Copying Data On-site

    Users are strongly encouraged to copy their data to an external hard drive or USB device immediately after completing the experiment. Data can be copied directly from the beamline workstation or from the data server terminal provided in the experimental control area. The BL2.2 beamline scientist or local contact can help locate your folder and verify that all scans are saved correctly before you leave.

    1. Requesting Data After Leaving SLRI

    If you forget to back up your data during your visit or need additional copies, you can request remote access or a data transfer: Contact your local BL2.2 scientist or beamline staff by email.

    Provide the following details:

    • Proposal ID or beamtime number
    • Date of your experiment
    • Name of principal investigator (PI)
    • Specific samples or scans required

    Tip: Before leaving SLRI, confirm with your local contact that 

      (1) all your scans are complete, 

      (2) the data folder is backed up, and 

      (3) the data copy on your external drive opens correctly.

    1. Experimental Feedback
      1. The Institute kindly requests all synchrotron users to submit the following reports after completing their beamtime:
      2. End of Experiment Feedback: Please complete the post-experiment satisfaction evaluation through the BeamAppsystem after your experiment.
      3. Experimental Report: Please submit a report summarizing the experimental results within 14 days after the completion of the experiment via BeamApp.

    (https://user.slri.or.th/beamapp/Account/login_Beamapp)
  • Research Highlights

    News & Update

    Stay updated with the latest conferences, workshop announcements, system upgrades, and call-for-proposal schedules.

    Research Highlights

    Battery

    • Study Lithium-extraction and insertion mechanisms in materials.
    • Monitor dynamic phase transformations and metastable phase formation during charge-discharge cycles.

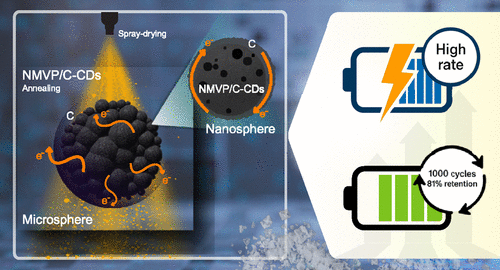
    Enhancing the Rate Capability and Cycling Stability of Na4MnV(PO4)3/C Composite Cathodes via in Situ Carbon Dots Formation for Sodium-Ion Batteries

    Sujeera Pleuksachat, Nattha Chaiyapo, Komsak Aranmala, Phongsit Krabao, Natthapong Kamma, Songyoot Kaewmala, Natthawan Prasongthum, Wanwisa Limphirat, Yujeong Jeong, Myong Yong Choi, Jeffrey Nash, and Nonglak Meethong

    To address the low conductivity of NASICON-structured Na4MnV(PO4)3 (NMVP), this study introduces NMVP/C-CDs synthesized via a scalable spray-drying method using carbon dots (CDs) derived from coconut shells. This approach significantly enhances electronic conductivity and structural stability, achieving excellent rate performance and 81.1% capacity retention over 1000 cycles. The results position NMVP/C-CDs as a highly efficient and commercially viable cathode material for sodium-ion batteries.

    https://doi.org/10.1021/acsaem.5c00766

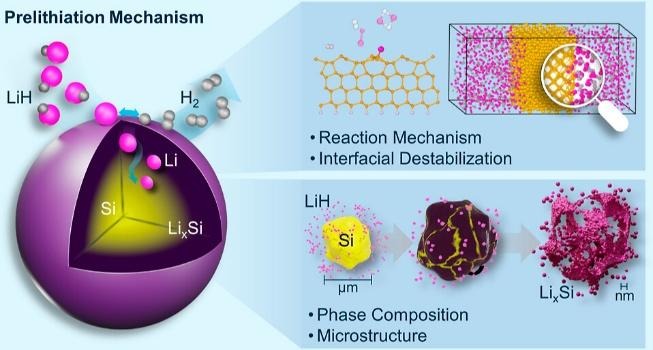
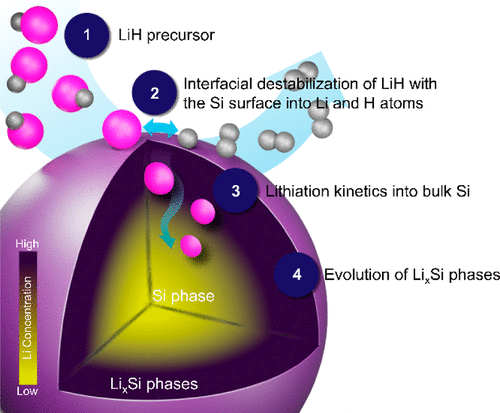
    Prelithiation Mechanism of Silicon Anodes through the Interfacial Destabilization of Lithium Hydride

    Natthapong Kamma, Kiettipong Banlusan, Komsak Aranmala, Orapa Tamwattana, Wanwisa Limphirat, Chatree Saiyasombat, Jeffrey Nash, Pimpa Limthongkul, Nonglak Meethong

    This study offers mechanistic insights into the processes of phase transformation and microstructural evolution through the prelithiation mechanisms of LiH and Si materials, using TEM, in situ XRD, and computational simulations. It reveals key aspects of prelithiation in Si, including interfacial interactions, thermodynamics, and kinetic lithiation processes.

    https://doi.org/10.1021/acsaem.4c01957

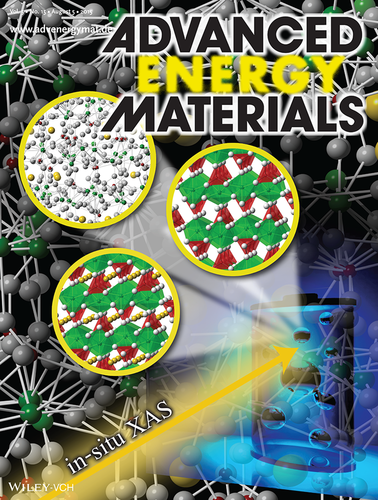
    XANES Investigation of Dynamic Phase Transition in Olivine Cathode for Li-Ion Batteries

    Sarawut Pongha, Boonyarit Seekoaon, Wanwisa Limphirat, Pinit Kidkhunthod, Sutham Srilomsak, Yet-Ming Chiang, and Nonglak Meethong

    the use of in situ X-ray absorption spectroscopy (XAS) to investigate dynamic phase transition in a LiFePO4 (LFP) cathode for Li-ion batteries. Formation of an intermediate amorphous phase occurs as a result of dynamic phase transition of LFP, in addition to the known crystalline FP phase. This technique can be used to probe the formation of non-crystallline metastable phases that are difficult to track using other methods.

    https://doi.org/10.1002/aenm.201500663

    Catalyst

    • Investigate oxidation states and coordination during Temperature-Programmed Reduction (TPR).
    • Monitor catalyst activation and deactivation under various gas atmospheres (H2, O2, CO, etc.).

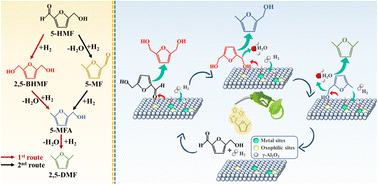
    Continuous flow hydrogenolysis of 5-hydroxymethylfurfural into 2,5-dimethylfuran over alumina-supported nickel–iron alloy catalysts

    Munsuree Kalong, Atthapon Srifa, Sakhon Ratchahat, Wanida Koo-amornpattana,   Yingyot Poo-arporn, Wanwisa Limphirat, Pongtanawat Khemthong, Suttichai Assabumrungrat, Keiichi Tomishige, and Sibudjing Kawi

    This study demonstrates the continuous hydrogenolysis of 5-HMF into 2,5-DMF (a next-generation biofuel) using bimetallic NiFe/γ-Al2O3 catalysts. The optimized Ni0.74Fe0.97Al catalyst achieved a 90.5% yield of 2,5-DMF with total conversion at 160 °C, significantly outperforming monometallic versions. Characterizations via XRD and in situ XANES revealed that the formation of a NiFe alloy and the balance of acidic sites were key to enhancing catalytic activity and metal-support interactions.

    https://doi.org/10.1039/D2SE01683D

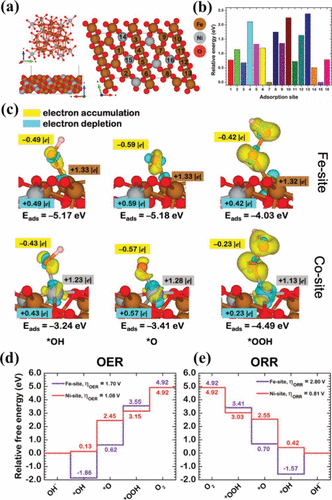
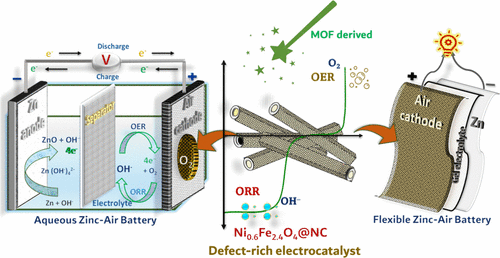
    3D Hierarchical MOF-Derived Defect-Rich NiFe Spinel Ferrite as a Highly Efficient Electrocatalyst for Oxygen Redox Reactions in Zinc–Air Batteries

    Mohan Gopalakrishnan, Wathanyu Kao-ian, Meena Rittiruam, Supareak Praserthdam, Piyasan Praserthdam, Wanwisa Limphirat, Mai Thanh Nguyen, Tetsu Yonezawa, and Soorathep Kheawhom*

    This study presents a 3D hierarchical NiFe spinel ferrite-inspired structure, designed for superior energy storage. It highlights its rational, electronically delocalized, cation defect-rich architecture on N-doped graphitic carbon sheets, promising to revolutionize oxygen electrocatalysis in large-scale applications through enhanced active site availability and transport.

    https://doi.org/10.1021/acsami.3c17789

    Thin Film

    • Real-time monitoring of electro-deposition processes for alloys like Fe-Ni.
    • Observe atomic relocation and oxidation state changes during thermal annealing.

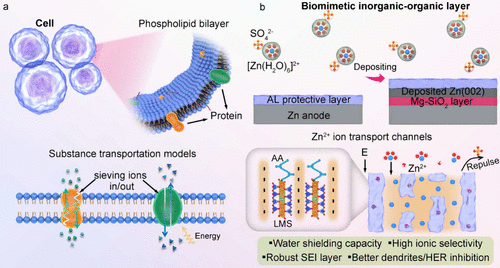
    Biomimetic Inorganic–Organic Protective Layer for Highly Stable and Reversible Zn Anodes

    Chengwu Yang, Pattaraporn Woottapanit, Sining Geng, Rungroj Chanajaree, Kittima Lolupiman, Wanwisa Limphirat, Xinyu Zhang*, and Jiaqian Qin*

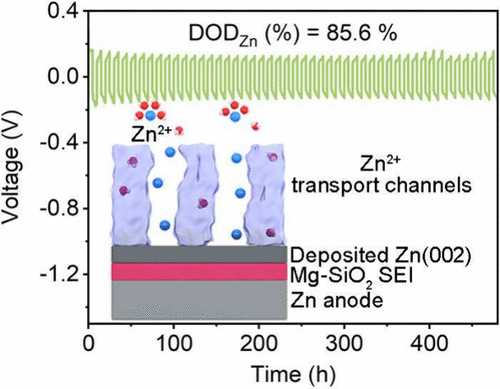
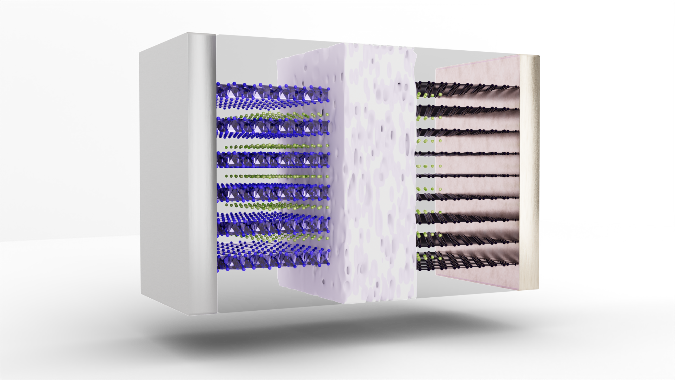
    This cover art depicts a biomimetic inorganic–organic protective layer on the Zn anode, which establishes abundant negatively charged ion microchannels to facilitate fast Zn2+ transportation and modulate the ionic solvation structure but also forms a Mg–SiO2 interphase with high Young’s modulus and strong zincophilicity during the cycling process, ultimately enabling a stable and reversible Zn anode.

    https://doi.org/10.1021/acsenergylett.4c03005

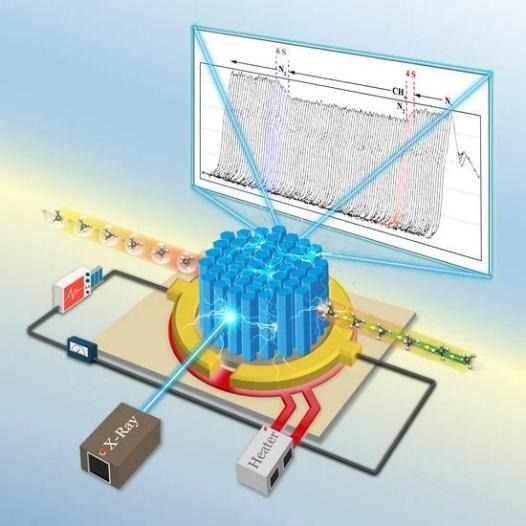
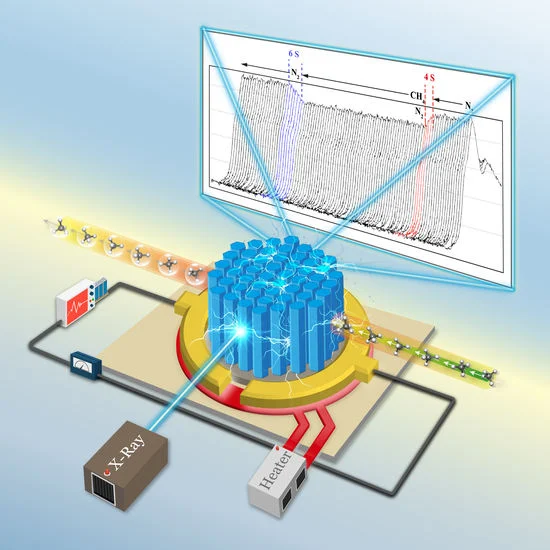
    An Operando X-ray Absorption Spectroscopy Study on Sensing Characteristics of Vertically Aligned ZnO Thin Film for Methane Gas Sensors

    Suriya Duangmanee, Yingyot Poo-arporn, Pattanaphong Janphuang, Pimchanok Leuasoongnoen, Surangrat Tonlublao, Phitsamai Kamonpha, Natawan Saengchai, Narong Chanlek, Chatree Saisombat, Pinit Kidkhunthod, and Rungtiva P. Poo-arporn

    This study demonstrates the fabrication of vertically aligned ZnO nanorods using a combined sputtering and hydrothermal approach for methane gas sensing. Scanning electron microscopy (SEM) confirmed the growth of hexagonal nanorods (50 nm diameter) on a dense seed layer, while Zn K-edge XANES analysis verified the structural integrity of the ZnO film. Crucially, simultaneous XANES and sensing measurements revealed a strong correlation between the ZnO structural properties and sensor performance under optimal conditions.

    https://doi.org/10.3390/nano12081285

  • To find the three-dimensional structure of the protein.

    To find the three-dimensional structure of the protein.

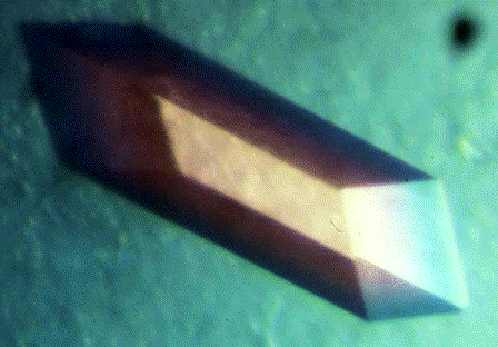
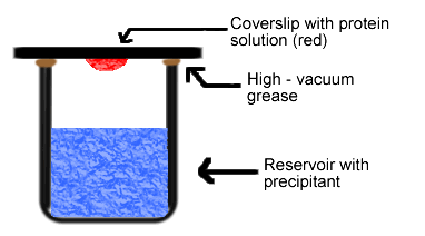
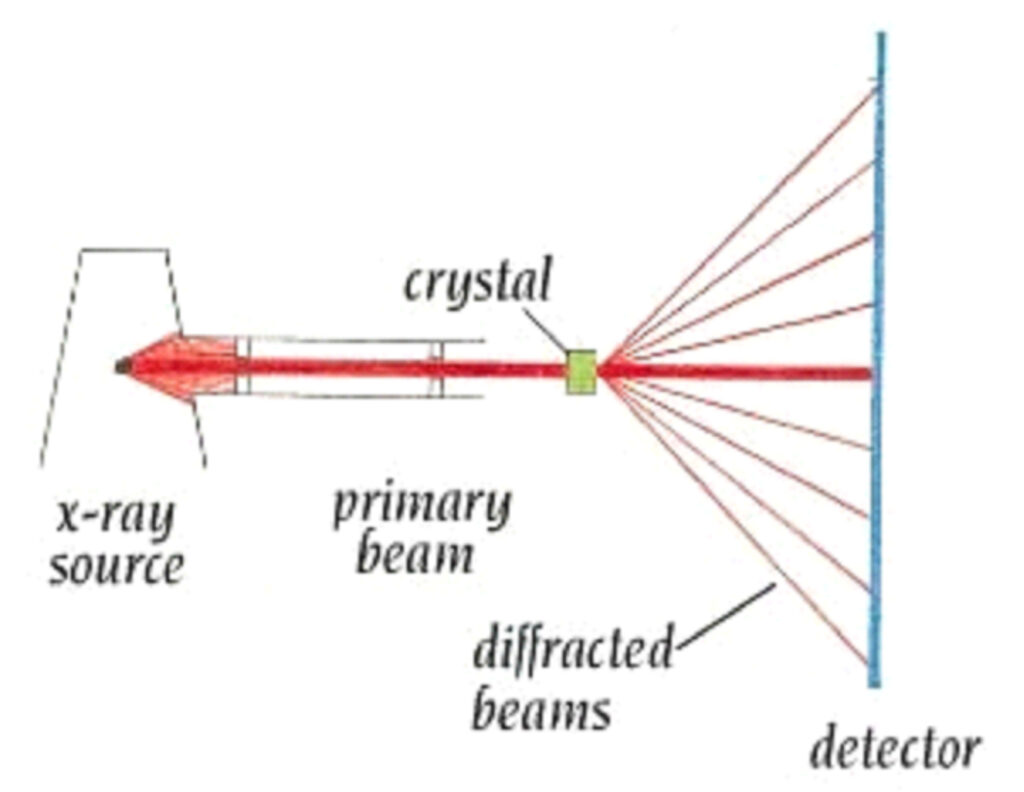
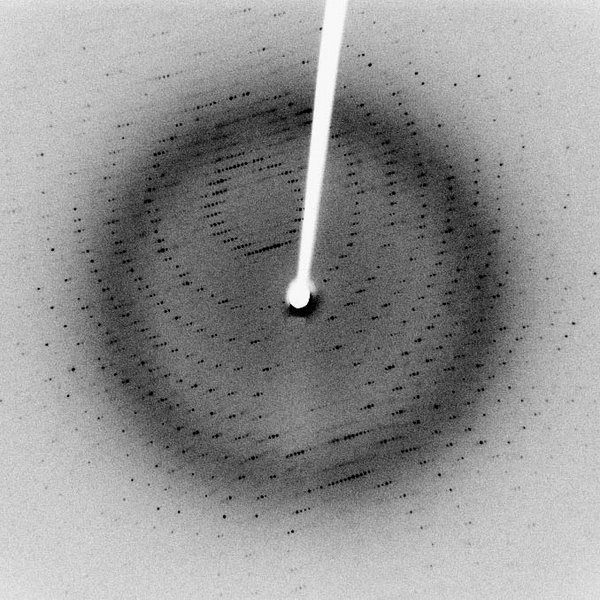
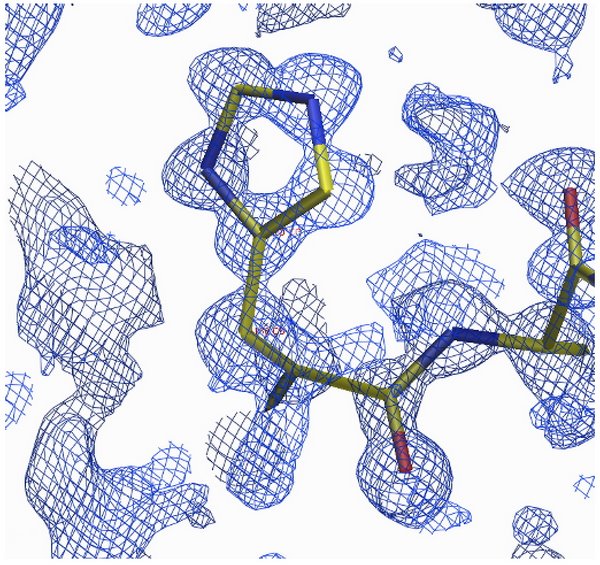
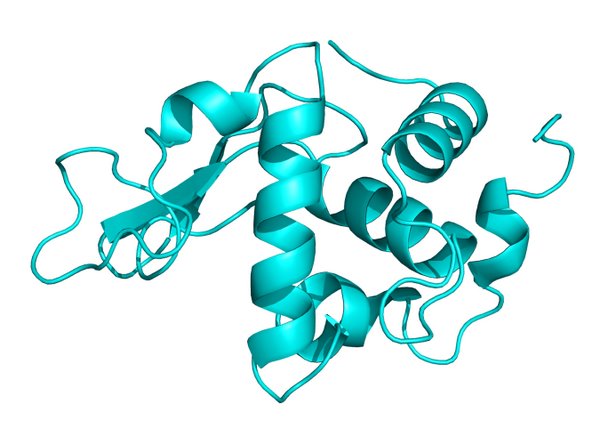
    Technique three-dimensional structure relies on the refraction of x-rays of the crystalline compound, large (Macromolecule Crystallography) to form the three-dimensional structure of a biomolecule such nucleic acids and proteins, if we know the structure of a biomolecule such, indeed, is useful in the control function or the mechanism of biomolecule such as to the direction in which to effectively which is useful for the applied Sciences and medical Sciences, the first step is the preparation of single crystals of biomolecules Then single crystal such information refraction of x-rays which is caused by radiation which has a wavelength in the level of x-rays to the incident atoms arranged orderly in the plane of the crystals of the compound molecular model the refraction of x-rays that have called stereotypes refraction of x-rays data processed in order to find a group symmetry and unit cell of the crystals after the processing step, therefore, to find the initial phase, thus leading customization process model structure to find the diagram, the density of electrons to find the perfect structure further.

    Technique three-dimensional structure relies on the refraction of x-rays of a crystalline substance

    The origin of instagram http://beatrizbiominds.wordpress.com/

    Prepare crystals

    The origin of instagram http://xray.bmc.uu.se/terese/

    Protein crystals

    The origin of the figure  Creighton, T. (1993). Proteins: structures and molecular properties. New York: Editorial W. H. Freeman & Co.

    Storage refraction of x-rays.

    alt

    The origin of instagramhttp://arrowthroughthesun.blogspot.com/2009_08_01_archive.html

    Stereotypes refraction of x-rays.

    Customize the model structure

    The origin of instagram http://www.spring8.or.jp/wkg/BL41XU/solution/lang-en/SOL-0000001166?set_language=en&cl=en  

    Diagrams density, electron

    The three-dimensional structure of the protein.

  • Beamline Staff

    Beamline Staff

    Dr.Wanwisa Limphirat

    Head of X-ray Spectroscopy section

    Email: wanwisa@slri.or.th

    Tel: +66 44 217 040 ext 1480

    Mr.Surachet Ratanasuporn

    Beamline Scientist II

    Email: surachet@slri.or.th

    Tel: +66 44 217 040 ext 1402

    Mrs.Weeraya Wongtepa

    Beamline Scientist II

    Email: weeraya@slri.or.th

    Tel: +66 44 217 040 ext 1404

    For any questions about applying for beamtime or for additional information regarding a BL2.2 beamtime application, please contact the User Office.

  • Knowledge about light, synchrotron tron

    Knowledge about light, synchrotron tron

    Light, synchrotron tron what is

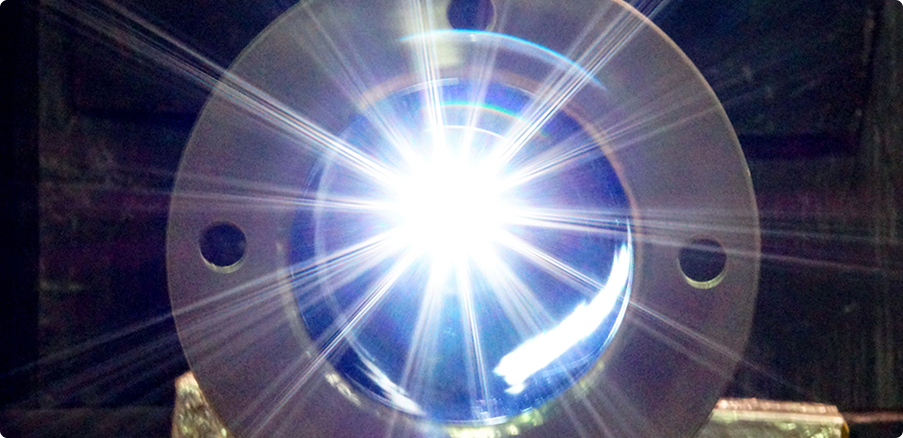
    Light, synchrotron tron is the light that was unleashed from the electron-turn curve with a speed near the speed of light(speed of three hundred million meters per second.

    Or about one billion kilometers per hour)

    Why need light, synchrotron tron

    Light, synchrotron tron is the light intensity, high energy value, continuous, comprehensive, range, wide power from the range of infrared radiation, until the x-rays makes can be applied to a variety of

    We produce light, synchrotron tron?

    In the production of light, synchrotron, electron, we need to have an electron moving with a speed near the speed of light, and forced to turn the arc, so the light source synchrotron, electron, therefore, consists of three main components, the part is

    1. Electron gun used for the production of particle beam of electrons
    2. System accelerator for the acceleration of the electron
    3. Band retention electron storage for a casual particles, high speed electrons, and forced to turn the curve with the magnetic field to release the light, synchrotron tron

    Why must the electron

    Truth, then, charged particles, all moving with the acceleration of plain emit synchrotron tron all, but due to the intensity of light, synchrotron tron released inversely proportional to the mass of the particle to the fourth in the production of light, synchrotron, electron, so it requires charged particles with mass, the youngest of which are electrons or positrons, but positrons that’s antiparticle, which produce it, complicated light source synchrotron, electron, so use electron

    We produce electrons?

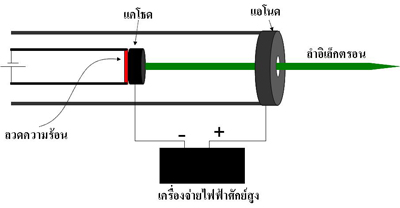
    Particles, electrons can be produced using a device called a tube cathode Assembly which contains components as shown in the picture

    Part of the cathode Assembly that is an alloy, when burned, allows the heat will make the electrons, the surface of the metal, dropped out, and when the power supply potential (high electron gun of the generator light Siam using the electric potential 120 kV) to the Orthodox Church, is the cathode and the anode is the anode, the electrons which have a negative charge from the cathode Assembly will run towards the anode and through out into the particle accelerator to accelerate further energy

    We accelerate the electrons?

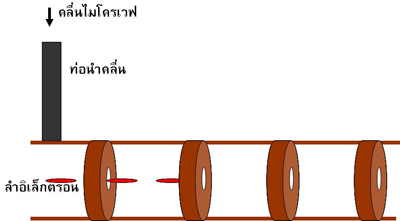
    When the electron beam was produced from the electron gun will move into the particle accelerator direct (Linear accelerator or Linac) by the particle accelerator direct this is a copper pipe that was partition into the room as shown in the picture

    The images show the structure, particle accelerators, direct

    Inside the pipe is filled with waves, microwaves are 8 million watts, frequency of 2856 MHz, which was produced by a device called Chrysler tron, and was sent to the particle accelerator direct via pipes, lead the wave (wave guide) when an electron moving in a pipe, it will be accelerated by the electric field of the microwave

    An electron is accelerated by a particle accelerator direct until power is 40 million electron volts, then the electron will be sent to accelerated in particle accelerators, circular called the booster synchrotron tron (booster synchrotron)

    Show photo accelerators direct (LINAC)and a booster synchrotron tron (SYN)

    In the booster synchrotron tron box copper called room, radio frequency, or RF cavity, which inner packing the radio waves are 35 kW and a frequency of 118 MHz when an electron moving through the RF cavity, it will be accelerated by the electric field of the radio waves to make energy, gradual increases in each round, moving in the booster synchrotron, electron by electron will move in the booster synchrotron tron (within the circumference of 43 meters), about 4 million cycles takes about 0.6 seconds, it will power 1 billion electron volts, which has a speed of about 99.999986% of the speed of light

    Why electron-turn bend release of light, synchrotron tron

    Reply simple, electrons are charged particles, which are particles called photons surrounded, when the electron lines, make the particle photon is a salad out (similar to that of being thrown out of the car rounded the corner), particle photon from being thrown out, it is light, synchrotron tron

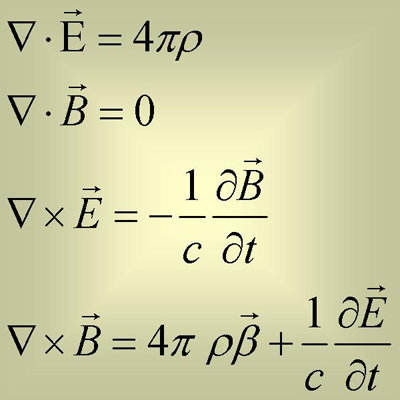
    Reply with physicist physics behind the liberation, the light, synchrotron tron is the equation of electromagnetic Maxwell’s

    Four equations this equation tells of the relationship between the charge (alt)the speed of the movement of electric charge (aalt)electric field (aalt)and magnetic field (alt) can translate these equations into words is
    1. Electro is the origin of the electric field.
    2. Electro motion causes a change of the electric field and the induced magnetic field

    Therefore, it was concluded that the electrical charge that moves causes the electromagnetic field in which the electromagnetic field is what we call light and electron is the charge, so we conclude that an electron moving at light always

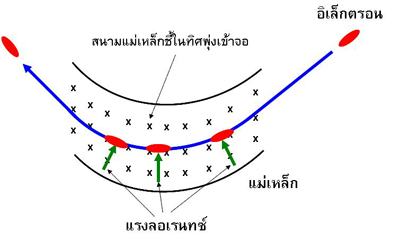
    When solving equations, electromagnetic Maxwell’s found that the electromagnetic field, or it is light, synchrotron tron emanating depend on the acceleration of electrons, also found that the acceleration is in perpendicular to the motion, that will give light, synchrotron tron with a higher intensity than the acceleration in parallel, very, this is why we need to force electrons, turn, curve, since while cornering. the electron will have the acceleration, which we called the acceleration towards the center, which has a direction perpendicular to the horizontal motion of the electron

    We compel the electron-turn the curve?

    We make the electrons turn the arc using a magnetic field when an electron moving through a magnetic field will cause a force perpendicular to the motion is called the force Lauren (Lolentz force) make the electron motion is an arc of a circle by the radius of curvature of the turn relative to the value of the magnetic field and the speed of the electron when cornering. the electron will emit synchrotron tron come out

    In the loop retention electrons of the generator light Siam with a magnet, steering, or called a bending magnet, the number 8, which is electromagnetic create a magnetic field using a coil wrapped around the iron core and flow 1800 amperes into coils to create a magnetic field, size 1.44 Tesla makes the electrons turn the curve with the radius of curvature 2.78 m

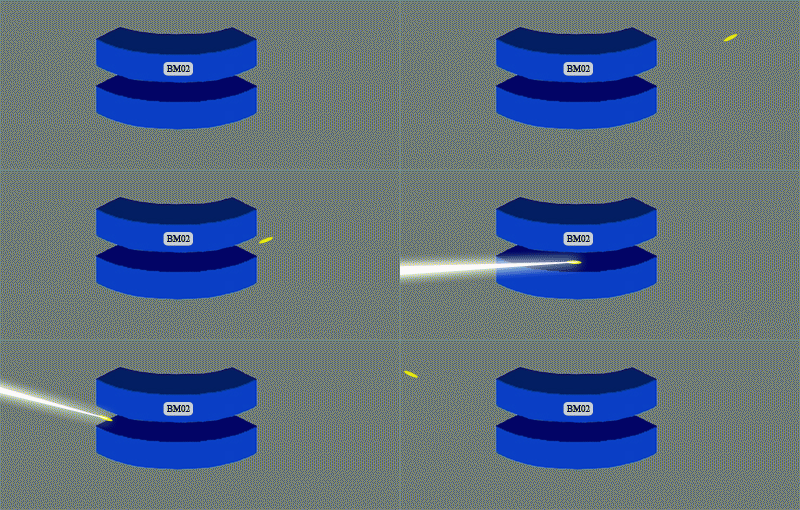
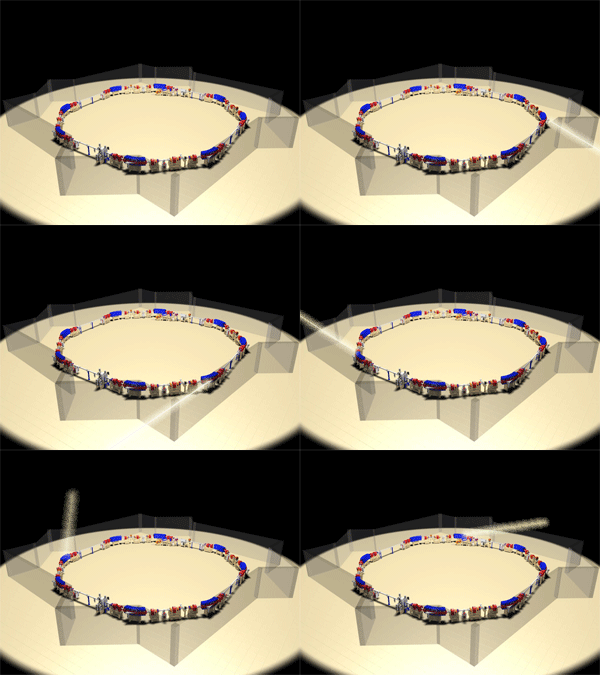
    The picture shows the magnetic steering (bending magnet) of the band the retention of the electrons of the generator light Siam and light emission, synchrotron, electron by electron cornering.

    Photo show light emission, synchrotron, electron by electron, turn the bend in the magnetic steering all eight of the band retention electrons of the generator light Siam

    Why must turn the curve with high speed

    When the electron-turn curve at high speed is born, according to the theory of relativity makes the moment, the electrons emit light that shorter, which make it look like the light emanating from multiple points in the arc that arrive simultaneously, resulting in a light, synchrotron tron is casual small cone with high intensity

    Light, synchrotron tron special?

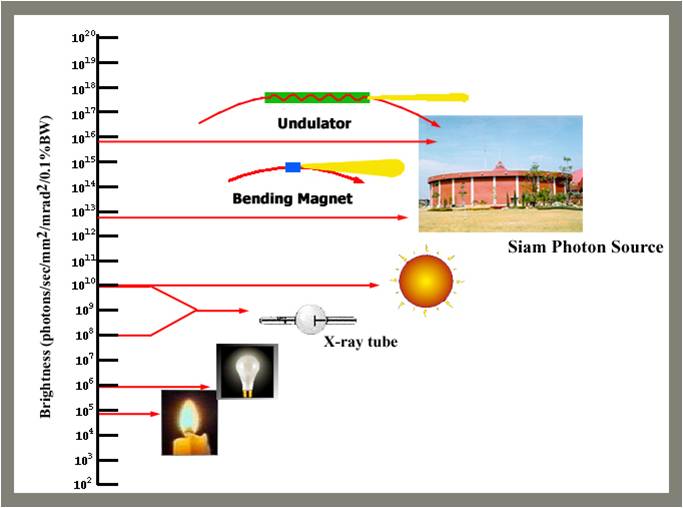
    A high-intensity light.

    From the results of the theory of relativity makes the light a tron look is casual small cone with high intensity by precious light intensity per unit area of origin, higher than the sun about a million times.

    Light is precious wavelength width

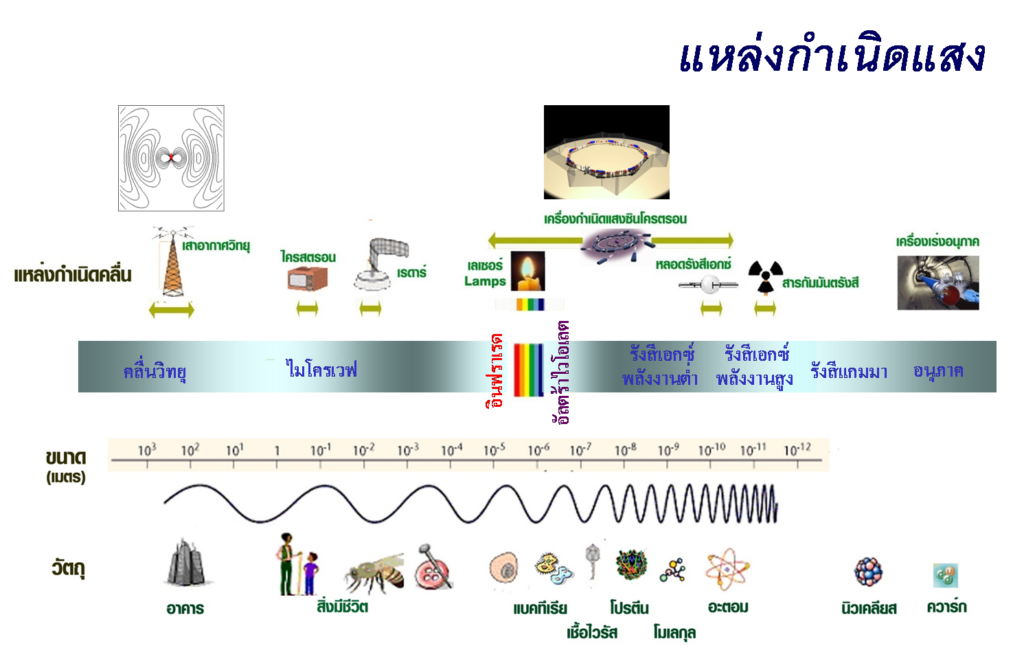
    Due to the light, synchrotron, electron is released from the free electron value of the wavelength of light, thus covering a wide wavelength range from the near infrared up until x-rays make can be applied to a variety of applications.

    Light source synchrotron, electron origin to the light precious a wide wavelength range from infrared to x-rays which wavelength range covering the size of a cell, protein molecules until the atom, so it can use the light synchrotron tron study the composition and structure of these things.

    We use light, synchrotron tron made?

    Light, synchrotron tron be used as a tool in educational research a variety of fields, especially the study of the composition and structure of various materials.

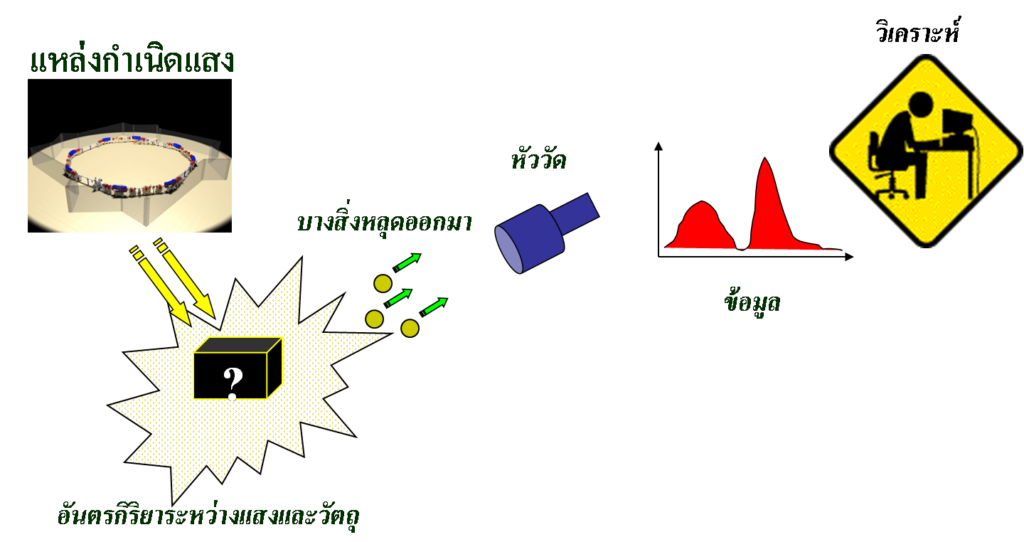
    The study of the composition and structure of materials relies on the use of light, synchrotron tron stimulate the atoms inside the material, which will cause some processes, such as light was born scattering from a material or materials with the absorption of light or something fell out of the material, such as an electron fall out, or material with the liberation of x-rays, then to system, measure for measure light scattering or measure the optical density or measure the electrons or x-rays that are released, and then analyses the data is composition or structure material

    What made measured after excitation with light, synchrotron, electron will provide different information to the example, if the measured x-rays scattering out of the material will have the information of the size and shape of the molecules or the size and shape of nano-particles, or if the measured electron out of the material will have information on the surface characteristics of the metal or semiconductor if the measured absorption of x-rays of the material data, the distance between the atoms within the material, if the measured absorption of infrared light of the material will have the data type of chemical bonding in the material, or if measure x-rays emitted by the material would have the data type of a is an element of the material, it etc Light, synchrotron tron can also be used to create a mould small, micron-scale to create a piece miniature size

    Within the synchrotron light research Institute, so there is experimental station is around band retention electrons by the experiment station these are known by the things made to measure, such as experimental station scattering of x-rays experiment station absorption of x-rays experiment station to bearing x-rays etc.

    The picture shows schematically the experimental station of the synchrotron light research Institute, the Central image is the band retention electron octagon circumference 81 m experiment station at the end of the synchrotron light, which is mounted around the circumference retention electrons each station trial light synchrotron tron wavelength range specifically for the technique to measure various

    By Dr. Supakorn new love

    Synchrotron light research Institute (public organization)

  • Beamline Layout & Specification

    Beamline Layout & Specification

    Time-resolved XAS Beamline Technology

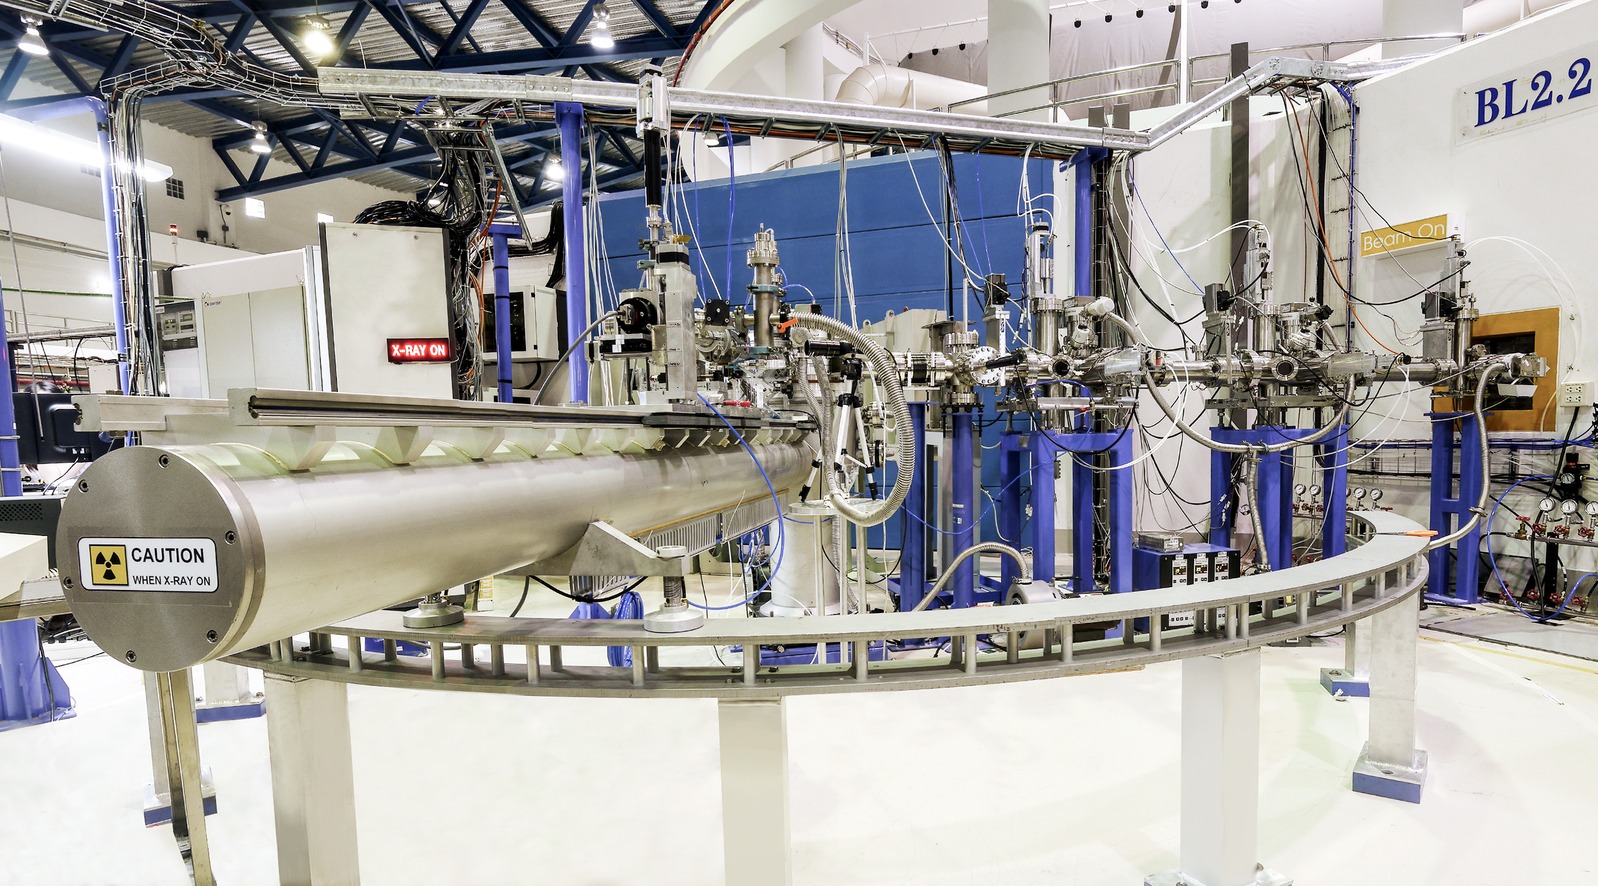
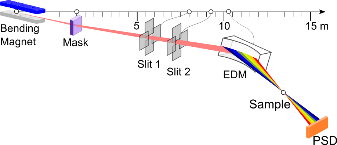
    The TRXAS beamline (BL2.2) employs an energy-dispersive monochromator (EDM) based on a bent Si(111) crystal, which horizontally focuses the polychromatic X-ray beam to a focal spot of approximately 1 mm at the sample position. This energy-dispersive configuration enables the entire X-ray Absorption Near Edge Structure (XANES) region to be collected simultaneously, without mechanical energy scanning.

    ED-XAS (Energy-dispersive X-ray Absorption Spectroscopy)

    The TRXAS beamline (BL2.2) was established and commissioned in 2012, utilizing the     ED-XAS (Energy-Dispersive X-ray Absorption Spectroscopy) scheme. Key hardware, including the energy-dispersive monochromator (EDM) and a 2-theta arm, was donated by the University of Bonn, Germany.

    • Design Strategy

    To compensate for the absence of an optical mirror, the beamline was designed with a very short physical length (approx. 9.7 m). This maximizes photon flux and provides a large acceptance angle of 8 mrad, which in turn allows for a broader X-ray energy range.

    • Monochromator

    Uses an Energy Dispersive Monochromator (EDM) with bent Si(111) and Si(220) crystals to focus a polychromatic beam onto the sample.

    • Operating Range

    Wide 2θ range (30° – 55°) supporting 4–12 keV, covering Ti K-edge to Pt L3-edge.

    • Flexibility

    The elliptical curvature of the crystal is precisely adjustable via a three-axis goniometer.

    TRXAS (Time-resolved X-ray Absorption Spectroscopy)

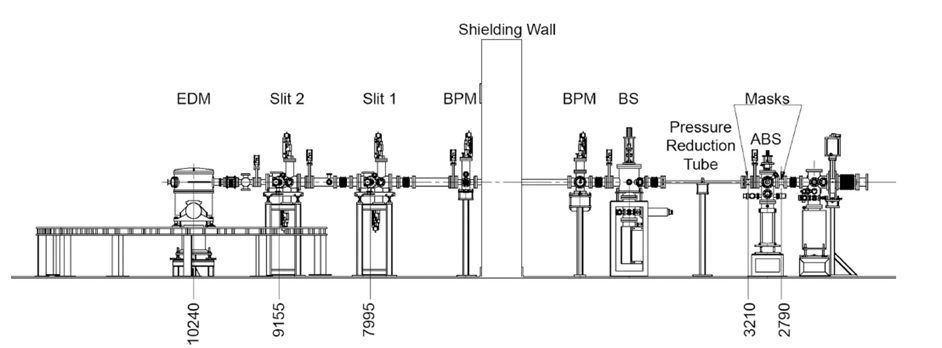
    Schematic of the TRXAS beamline showing the main components, namely the heat absorber (ABS), front-end mask, differential-pressure tube, beam shutter (BS), retractable water-cooled Be foil, beam-position mornitor (BPM), two sets of vertical and horizontal slits and EDM. Distances from the source (in mm) are also shown.

    Performance and Scanning Speed

    The scanning speed performance of the endstation was evaluated by measuring the X-ray absorption of a 5 μm thick Ti foil. The Ti K-edge XANES spectra successfully resolved the characteristic absorption features of metallic titanium with a temporal resolution as fast as       25 ms, although with a relatively low signal-to-noise ratio.

    Data quality improves significantly as the acquisition time increases to 200 ms or more. Based on the current synchrotron beam quality, the optimal recording speed for high-quality spectra typically ranges between 500 ms and 1 second.

    Beamline Specification

    ParameterSpecification
    X-ray SourceBending Magnet (1.2 T)
    Energy Range4.0 – 12.0 keV
    Beam Size1 mm (H) x 2 mm (V)
    Beam Divergence at Sample (mead)(FWHM)
    MonochromatorBent Crystal Si(111) and Si(220) (Optional)
    Min. Acquisition Time25 ms per spectrum
    DetectorNMOS with Scintillator (1024 pixels)
    Optical Bench2.8 m long
  • Thin Film

    Thin Film

    Thin Film Research Highlights – BL2.2 TRXAS

    At the BL2.2 (TRXAS) beamline, X-ray absorption spectroscopy enables real-time monitoring of electro-deposition processes for alloys such as Fe–Ni, and the observation of atomic relocation and oxidation-state changes during thermal annealing. The works below highlight recent thin-film research enabled by the beamline.


    Biomimetic Inorganic–Organic Protective Layer for Highly Stable and Reversible Zn Anodes

    This work describes a biomimetic inorganic–organic protective layer on the Zn anode that establishes abundant negatively charged ion microchannels to facilitate fast Zn2+ transport and to modulate the ionic solvation structure. During cycling it also forms an Mg–SiO2 interphase with high Young’s modulus and strong zincophilicity, ultimately enabling a stable and reversible Zn anode.

    Authors: Chengwu Yang, Pattaraporn Woottapanit, Sining Geng, Rungroj Chanajaree, Kittima Lolupiman, Wanwisa Limphirat, Xinyu Zhang, and Jiaqian Qin

    Read the publication: https://doi.org/10.1021/acsenergylett.4c03005


    An Operando X-ray Absorption Spectroscopy Study on Sensing Characteristics of Vertically Aligned ZnO Thin Film for Methane Gas Sensors

    This study demonstrates the fabrication of vertically aligned ZnO nanorods using a combined sputtering and hydrothermal approach for methane gas sensing. Scanning electron microscopy (SEM) confirmed the growth of hexagonal nanorods (50 nm diameter) on a dense seed layer, while Zn K-edge XANES analysis verified the structural integrity of the ZnO film. Crucially, simultaneous XANES and sensing measurements revealed a strong correlation between the ZnO structural properties and sensor performance under optimal conditions.

    Authors: Suriya Duangmanee, Yingyot Poo-arporn, Pattanaphong Janphuang, Pimchanok Leuasoongnoen, Surangrat Tonlublao, Phitsamai Kamonpha, Natawan Saengchai, Narong Chanlek, Chatree Saisombat, Pinit Kidkhunthod, and Rungtiva P. Poo-arporn

    Read the publication: https://doi.org/10.3390/nano12081285

  • Catalyst

    Catalyst

    Catalyst Research Highlights – BL2.2 TRXAS

    At the BL2.2 (TRXAS) beamline, X-ray absorption spectroscopy is used to investigate oxidation states and coordination during Temperature-Programmed Reduction (TPR), and to monitor catalyst activation and deactivation under various gas atmospheres (H2, O2, CO, etc.). The works below highlight recent catalysis research enabled by the beamline.


    Continuous Flow Hydrogenolysis of 5-Hydroxymethylfurfural into 2,5-Dimethylfuran over Alumina-Supported Nickel–Iron Alloy Catalysts

    This study demonstrates the continuous hydrogenolysis of 5-HMF into 2,5-DMF (a next-generation biofuel) using bimetallic NiFe/γ-Al2O3 catalysts. The optimized Ni0.74Fe0.97Al catalyst achieved a 90.5% yield of 2,5-DMF with total conversion at 160 °C, significantly outperforming monometallic versions. Characterizations via XRD and in situ XANES revealed that the formation of a NiFe alloy and the balance of acidic sites were key to enhancing catalytic activity and metal–support interactions.

    Authors: Munsuree Kalong, Atthapon Srifa, Sakhon Ratchahat, Wanida Koo-amornpattana, Yingyot Poo-arporn, Wanwisa Limphirat, Pongtanawat Khemthong, Suttichai Assabumrungrat, Keiichi Tomishige, and Sibudjing Kawi

    Read the publication: https://doi.org/10.1039/D2SE01683D


    3D Hierarchical MOF-Derived Defect-Rich NiFe Spinel Ferrite as a Highly Efficient Electrocatalyst for Oxygen Redox Reactions in Zinc–Air Batteries

    This study presents a 3D hierarchical NiFe spinel ferrite-inspired structure designed for superior energy storage. It highlights a rational, electronically delocalized, cation defect-rich architecture on N-doped graphitic carbon sheets, promising to advance oxygen electrocatalysis in large-scale applications through enhanced active-site availability and transport.

    Authors: Mohan Gopalakrishnan, Wathanyu Kao-ian, Meena Rittiruam, Supareak Praserthdam, Piyasan Praserthdam, Wanwisa Limphirat, Mai Thanh Nguyen, Tetsu Yonezawa, and Soorathep Kheawhom

    Read the publication: https://doi.org/10.1021/acsami.3c17789